CGDpheno3 project protocol
Multi-system survey of mouse physiology in 8 inbred founder strains and 54 F1 hybrids of the Collaborative Cross (2012)
Center for Genome Dynamics (CGD)With: Svenson KL, Lenarcic AB, Churchill GA, Valdar W
Project protocol — Contents
General workflow and samplingProcedure: Complete blood count (CBC) with differential
Workflow and sampling
Equipment and supplies
Reagents and solutions
Definitions and calculationsProcedure: Blood chemistry
Workflow and sampling
Equipment and supplies
Reagent and solutions
Definitions and calculationsProcedure: Blood pressure and pulse
Workflow and sampling
Equipment and supplies
Reagents and solutions
Definitions and calculationsProcedure: Electrocardiograms (ECG) in conscious mice
Workflow and sampling
Equipment and supplies
Reagents and solutions
Definitions and calculationsProcedure: Bone mineral density and body composition
General Workflow
Workflow and sampling
Equipment and supplies
Reagents and solutions
Definitions and calculations
Tests Blood glucose and lipids Acclimation to test conditions
In general all mice are brought into the procedure room and are tested within 1h.
----------------------------------------------------------------------------------------------------------------------------
Blood collected (200 µL); samples kept at 24°C (for <3 h) until analysis Hematology samples are run on the ADVIA 120 Hematology Analyzer
- Bayer ADVIA 120 Hematology Analyzer (Bayer Diagnostic Division (Siemens), Tarrytown, NY, USA)
- 1.5 mL Eppendorf tubes
- Microhematocrit tubes, EDTA coated
- Toothpicks
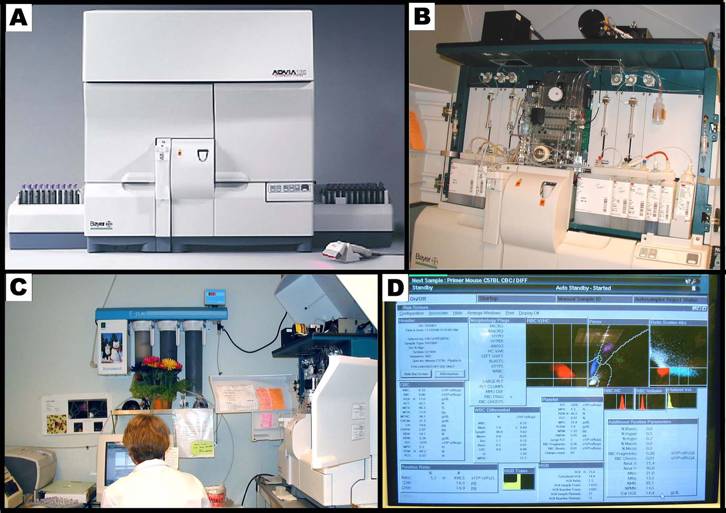
Panel A shows the Bayer ADVIA 120 hematology analyzer system. Panel B shows the internal layout of the ADVIA, and the various reagents used in the system. Panel C shows the hematology setup, equipped with a computer and a printer. Panel D shows a typical computer screen-output.Bayer Diagnostics (Siemens Healthcare Diagnostics)
• ADVIA TESTpoint Hematology Controls
• ADVIA 120 autoRETIC Reagent T01-3622-01
• Perox Sheath T01-3633-01
• Perox 1 T01-3630-01
• Perox 2 T01-3631-01
• Perox 3 T01-3632-01
• RBC/PLT T01-3627-01
• HGB T01-3628-01
• BASO T01-3629-01
• AutoRETIC T01-3622-01
• EZ KLEEN T01-3624-01
• Defoamer T01-3625-04
• Sheath/Rinse T01-3664-01
• 20% EDTA, Tetrasodium Salt (Fisher Lab item number BP121-500), anticoagulantProcedure: Complete blood count (CBC) with differential using the Bayer ADVIA 120 Hematology Analyzer
Blood collection
a. Blood samples are obtained from each mouse at 7 wks of age (non-fasted).
b. Collection tubes (1.5 mL Eppendorf) are pre-loaded with 20 µL of 20% EDTA.
c. A clean retro-orbital bleed is performed using EDTA-coated microhematocrit tubes.
d. Blood collection tubes are filled to a final volume of 200 µL and then kept at room temperature for the duration of the test.
e. The blood sample is checked for clots using a toothpick. (In the presence of a clot, the sample is discarded to avoid "aspiration failure" and lost data during sample run.)Using Bayer ADVIA 120 system to conduct CBC with differential and reticulocyte count
a. Blood samples are gently mixed well (by rolling the vial the between hands) and kept at ambient temperature.
b. Samples are run according to manufacturer's instructions.
c. As part of ADVIA daily routine maintenance, a control run is initially performed. This usually takes about 25 min. Since controls contain human blood cells in a preservative medium, proper safety precaution is exercised with the use of disposable gloves.
d. As long as calibrated commercial controls are within established ranges, the PRIMER sample can be run first (to get the system "wet") in preparation for the test samples. Each run takes about 1 min, when done through open tube aspiration wand.
e. After each successful run, a lab screen pops up that can be hidden to return to Manual Sample ID Screen, and to review the result via the quality control (QC) button.
f. After a hard copy of a successful run is automatically printed, the next sample is ready to be run.
g. Values reported are those obtained directly from the ADVIA.
h. No correction for the small dilution is made.WBC differential percentages were computed for each cell type as follows:
- % NEUT (neutrophils) = [(NEUT count x 103) ÷ (total WBC count x 103)] x 100
- % LYMP (lymphocytes) = [(LYMP count x 103) ÷ (total WBC count x 103)] x 100
- % MONO (monocytes) = [(MONO count x 103) ÷ (total WBC count x 103)] x 100
- % EOS (eosinophils) = [(EOS count x 103) ÷ (total WBC count x 103)] x 100
- % BASO (basophils) = [(BASO count x 103) ÷ (total WBC count x 103)] x 100
- % Retic (reticulocytes) = [(Retic count x 109) ÷ (total RBC count x 109)] x 100
- HCT (hematocrit) = (RBC X MCV)÷10 representing the PCV (packed cell volume)
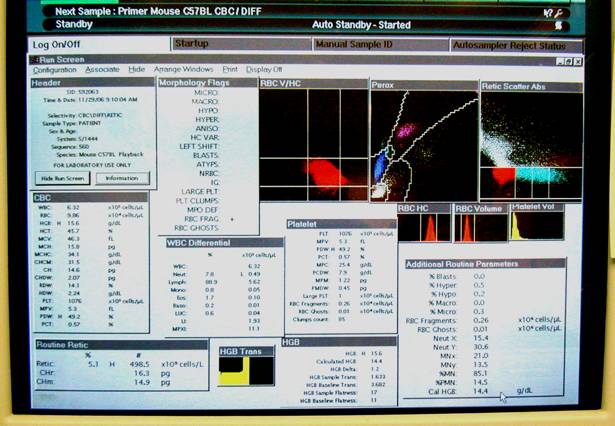
This figure illustrates a close-up display of the computer screen result in Panel D above.
--------------------------------------------------------------
Step
- Refrigerated tabletop micro-centrifuge: Eppendorf Centrifuge, Model # 5415
- Repeat pipettes and regular Pipetman: 250 µL and 100 µL, respectively
- Automated blood chemistry analyzer: Synchron CX5 Delta Clinical Chemistry Analyzer (Beckman Coulter, Inc., Fullerton, CA)
- A dedicated DOS-based desktop computer controls the programming of this analyzer
- A dedicated printer prints the results as they are measured, and an electronic file is simultaneously transferred to a second, Windows-based computer, which stores the data files
- Micro-hematocrit tubes (75 µL capacity) coated with Heparin and equipped with a rubber bulb expunger
- Expendables:
(1) 1.5 µL Eppendorf tube,
(2) 0.5 mL Beckman Coulter Microtube Tubecup ("sector cup")
(3) 100 µL and 250 µL pipette tips
(4) 1 cc syringes with needles
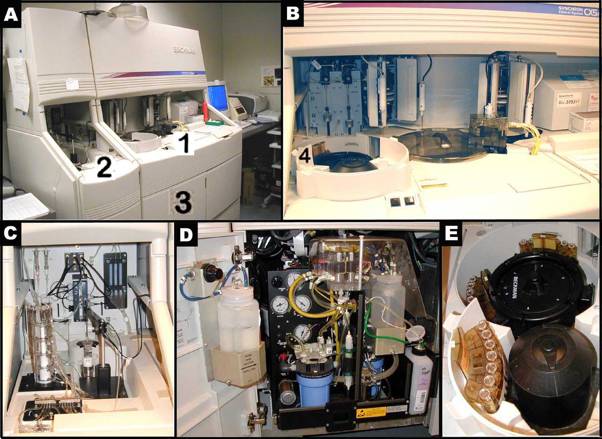
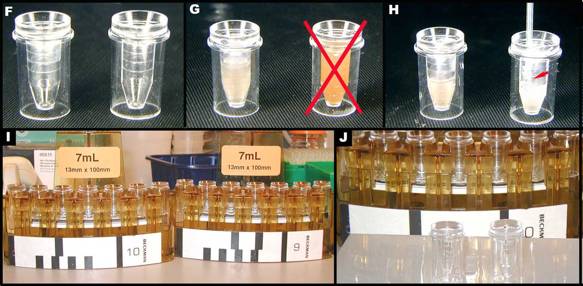
Panels A-E illustrate the Beckman Synchron CX5 Delta. Panel B shows a closer look of area 1 in Panel A. Panel C presents a closer look of area 2 in Panel A. Panel D depicts a closer view of area 3, where ancillary reagents are refilled in Panel A. Panel E reveals the content of area 4, where samples are set up in trays for an automated run in Panel B.
- Heparin anticoagulant (Sigma (Sodium Salt) 50,000 U Cat. #H-3393)
- Reagents: The Chemistry Analyzer (or "CX5") uses Beckman Coulter three-compartment reagent cartridges for HDL, CHOL, TG, and GLU. Each cartridge contains enough reagents for 300 tests (approximately 104 mL). In addition, in order to run the HDL Cholesterol test, HDL Cholesterol Separation Reagent (15 µL per sample) is needed. The bottle from Beckman Coulter contains a volume of 34 mL. If the dilution of plasma samples becomes necessary due to low plasma volume, use 0.9% saline solution for the dilution.
- Calibration Reagents: The two calibration reagents are "Synchron Systems HDL Cholesterol Calibrator" (for HDL only), and "Synchron Systems Multi Calibrator" (for CHOL, GLU, and TG).
- Controls: The controls for HDL are Beckman Coulter Vigil Lipid Control 1 and Beckman Coulter Vigil Lipid Control 2. The controls for CHOL, GLU and TG are Synchron Control Comprehensive Chemistry Control Serum Level 1, Level 2 and Level 3.
Procedure: Blood plasma chemistry and electrolyte measurement using Beckman CX5 Synchron Delta Chemistry Autoanalyzer
I. Blood plasma collection
a. Blood samples are obtained from each mouse at 8 wks of age.
b. Approximately 200 µL of blood are obtained from mice via retro-orbital bleed using heparin-coated Hematocrit tubes. Remaining blood in the Hematocrit tube is flushed out using a rubber squeeze bulb assembly.
c. Blood samples are collected into pre-labeled 1.5 mL Eppendorf tubes pre-loaded with 7.5 µL of the anticoagulant Heparin 1000 U/mL, gently finger flicked and mixed or stirred, and momentarily stored in ice until all the samples are ready to be centrifuged.
d. Blood samples are then centrifuged for 5 min at 14,000 RPM using a refrigerated table-top micro-centrifuge to separate the plasma.
e. The top plasma layer is pipetted (~100 µL) into pre-labeled 0.5 mL Eppendorf tubes and frozen until ready to be assayed; remaining packed blood cell layer is discarded.
f. Previously frozen samples are defrosted at room temperature for about 30 min before measurements are done.NOTES: Air bubbles are avoided and eliminated during sample loading in sector cups as they interfere with the colorimetric assay.
II. Using Beckman CX5 Synchron system to measure plasma glucose and lipids
Panel F shows 2 empty sector cups. Panels G shows sector cups with/out hemolyzed sample, and Panel H shows sector cups without and with (red arrow) air bubbles. Panels I and J show consecutive sector trays identified with bar codes and seven sector cups contained within each tray.a. In preparation for the auto-analyzer, bar-coded sectors with cups in place are loaded with 85 µL of completely thawed plasma (enough for the direct measurement of CHOL, GLU, and TG).
b. Up to five sectors are manually placed on the carousel to be run. Since each sector is bar-coded, the Beckman automatically detects a sector that has been run; regardless, finished sectors are removed immediately as soon as they come up.
c. The Beckman CX5 is operated according to manufacturer's instructions in the measurement of plasma HDL, CHOL, GLU, and TG, which are run together.
d. -Function key F1 is used to deploy "Sample Program", Sample type "2" is for plasma.
-Function key F2 is used to deploy "Program Batch/Sector(s)" and "sector(s) to program:" (i.e. sectors 1-5 is programmed). When "Batch" mode activated, 7 cups possible. "Number of cups in batch:" message is displayed, the total cups for this batch is then (7 x 5) = 35 cups (the maximum number of cups that can be ran in a batch is 98). To program remaining sectors, F2 Program Batch is deployed again.
-Panel "12" is preprogrammed for CHOL/GLU/TG and "HDLD" is manually "Selected" from the screen menu. Once the correct chemistries are selected, they are "ENTERed" to bring about "SAMPLE TYPE", wherein "2" is given to denote plasma (not serum).
-Function key F8 is used to set up the programmed batches and to advance to the next cup/sample (from cup #1 up to cup #7) in a given sector. By selecting F8 ID numbers can be recorded and reviewed against an Excel reference sheet.Notes: Since ID sample numbers or field identifiers are un-editable once Beckman CX5 is in operation, relevant information, including sample type (i.e. plasma vs serum), dilution factor, and other information must be precisely entered.
- As soon as six sectors are programmed, the <prev screen> is activated first, and then the Master Screen, and then last START (green) button. The Beckman automatically starts sampling the first five programmed sectors. Additional sectors can be programmed while the Beckman is operating.
-In the event that the Beckman alarm is activated because of reagent volume getting low, <prev screen> is activated to turn off the alarm and make the necessary notations for the record. The next available reagent cartridge is automatically installed.
-When all the data is safely recorded, Function key F5 is used to clear all the information regarding a sector after ENTERing the number of the sector to be deleted.e. Once a sector is finished running, the results are automatically printed, removed from the printer, and then labeled accordingly.
f. Used Eppendorf tubes, pipette tips, sector cups, and reagent cartridges are discarded into biohazard waste containers, and any spilled liquids are cleaned.The average of the diluents analyzer value is subtracted from the analyzer value multiplied by two (dilution factor) to obtain the HDL (indirect) values.
HDL (indirect) values = (sample analyzer value x 2) - average of diluents analyzer value
------------------------------------------------------------------------------------------------------------------------------
Mice acclimated to testing environment from Friday through the weekend before a 5-day testing period Mice trained for systolic blood pressure (SBP) and heart rate (HR) recording on the first 3 days On the final 2 days systolic blood pressure and pulse rate measured; 30 measurements/day
- Visitech BP-2000-tail cuff system (Visitech Systems, Apex, NC)
- Thermometers: alcohol or mercury filled
- Bandage scissors
- Balloons (for tail cuffs)
- Medical tape
- Paper towels
- Ethanol (70%) and/or "baby wipes"
- Smooth tubing clamps
- Heat gun
Acclimation to test conditions
Mice are acclimated and trained to test conditions for 3 days prior to obtaining recorded measurements.
Procedure: Blood pressure and pulse analysis using the Visitech BP-2000 system
Measurements of systolic blood pressure and pulse rate are obtained from unanesthetized 10 wk-old mice with minimal restraint using the Visitech BP-2000 system. The Visitech BP-2000 system is a non-invasive blood pressure and pulse analyzer that can accommodate 4 mice simultaneously per session. In order to obtain consistency in the results, mice are first conditioned in the system the same time everyday for at least 3 days prior to an additional 2 days of recorded measurements.
Essential checklist
a. Specimen platforms are set at exactly at 38°C for maintaining core body temperature during testing (VERY IMPORTANT). After enough time is allowed for temperature to stabilize, the correct temperature should register when measured in the middle of the heating platform. Failure to do so, not only compromises the results, but also may be fatal to mice in cases of hyperthermia (especially small mice).
b. Long 5-6" balloons are cut into 4 equal sections of 1 1/3" pieces. These balloon pieces are then installed and threaded through the tail-cuffs. Without stretching the balloons, they are shrunk and customized to fit the tail-cuffs with the use of a heat gun or a lighter.
c. The balloons are checked for holes by pumping air into the tail-cuffs at pressures not greater than 200 mm Hg that remain stable over a given time. In the event that the observed pressure is steadily lost, air is pumped up again and the balloon with the hole is systematically identified using a pair of smooth tubing clamp (not hemostats or forceps as they may damage the tubing) and then replaced.
d. Pressure is calibrated according to manufacturer's protocol. Briefly, by connecting directly the air supply tube to the sphygmomanometer, and inputting the values observed in the attached mercury column, these pressure calibrations are then compared with those displayed on the computer following inflations of the tail-cuff balloons at appropriate pressures.
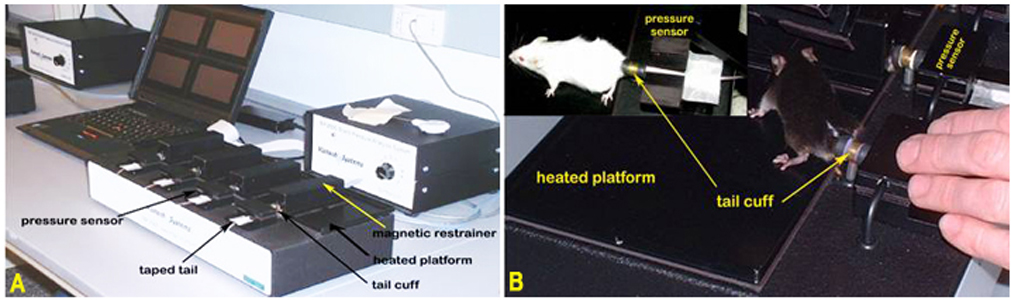
Panel A. The Visitech System for blood pressure and pulse measurements in mice. Panel B. Mice positioned for blood pressure measurement using tail-cuff method.Obtaining pulse and blood pressure measurements
a. Fully acclimated and trained mice are picked up by their tails and gently placed on a temperature-stabilized (38°C) platform. At least two thermometers are taped in the middle and on the side of the platform and covered with magnetic restrainers to provide additional means to monitor and to assure proper platform temperature.
b. The mice are then restrained in place (without anesthesia) using magnetized holders. Care is taken to prevent the feet from getting pinched by the magnets.
c. To facilitate measurement efficiency, automated 4-stage sphygmomanometers for mice are used to test 4 mice simultaneously in a given session.
d. Once the mice are properly secured, their tails are then passed through the cuffs and the optical hemodrometers, and the exposed proximal tail segments are fixed in place with bandage tape.
e. The mice may be left in the optical position for 5-10 min to promote body temperature stabilization. Any evidence of mouse sweating during measurement is noted, for it is likely indication of non-optimal or unregulated temperature.
f. The tail-cuff system is then turned ON to begin the process; air is automatically pumped into the balloons, consequently applying pressure on the tail vessels, so that waveforms of blood vessel expansions and contractions can be optically sensed and recorded.
g. Simultaneous recording of systolic blood pressure, diastolic blood pressure, and pulse rate measurements are automatically recorded at least 30 times per session.
h. In order to obtain reliable and accurate representation of blood pressure and pulse rate, measurements are taken the same way and at the same time for 2 consecutive days.
i. After all the data are collected and saved, the bandage tape is gently removed from the tail so that mice are able to come out of their restraints on their own and returned to their respective cages. The whole process is executed with the least amount of stress to the mice, while providing them an opportunity to calm down as well.
j. At the end of each session the platforms are cleaned with wet paper towel and then disinfected with "baby-wipes".Definitions & formulas
Systolic blood pressure: blood pressure during peak cardiac contraction.
Diastolic blood pressure: blood pressure during peak cardiac distension and relaxation.
Tail pulse: throbbing of the tail arteries as a consequence of heartbeat.
------------------------------------------------------------------------------------------------------------------------------
Electrocardiograms (ECG) in conscious mice
The platform is cleaned prior to each test session
- AnonyMOUSE ECG Screening System, for noninvasive recording electrocardiograms in conscious mice (Mouse Specifics, Inc. 28 State St., Suite 1112, Boston, MA 02109)
- Shielded 3-electrode lead set (M1605A Snap, Hewlett-Packard, Andover, MA)
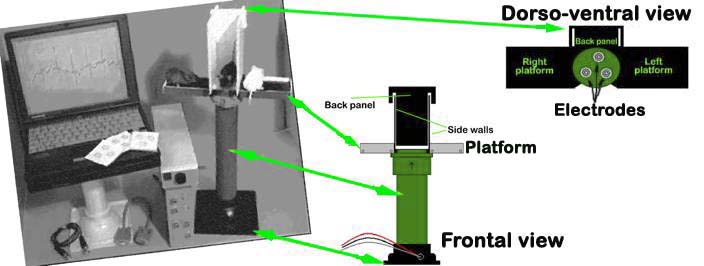
AnonyMOUSE® ECG Screening System
An array of gel-coated ECG electrodes (Red Dot; 3 M, St. Paul, MN) are embedded in the platform floor and spaced approximately 3 cm in between each other such that forelimb and hindlimb paws can simultaneously come in contact with the electrodes. Filter papers, with openings for the electrodes, are used to prevent mouse urine from short-circuiting the signals. The electrodes are connected to an amplifier (HP78901A, Hewlett-Packard, Andover, MA) by a shielded 3-electrode lead set (M1605A Snap, Hewlett-Packard, Andover, MA). The signals are digitized with 16-bit precision (DI-220, DATAQ Instruments, Inc., Akron, OH) at a sampling rate of 2500 samples/s.
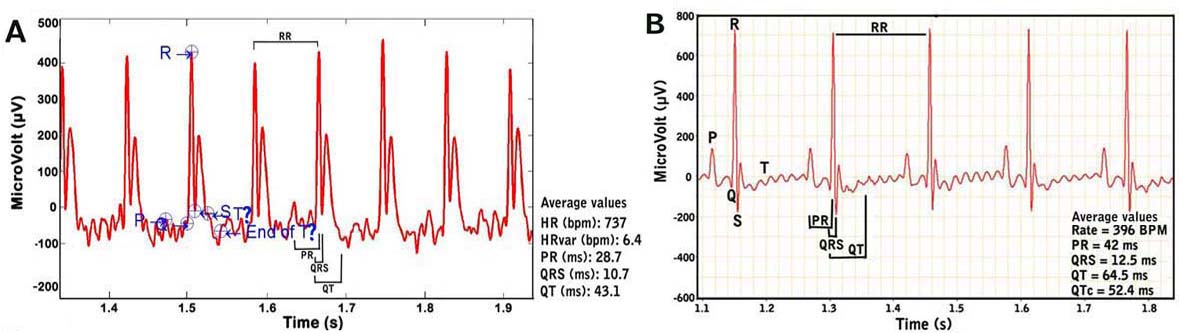
Data are transmitted to the mousespecifics.com web site (Mouse Specifics, Inc., Boston, MA) using standard file-transfer protocols for ECG signal analyses by e-MOUSE®. e-MOUSE®, an internet-based physiologic waveforms analysis portal, incorporates Fourier analyses and linear time-invariant digital filtering of frequencies below 2Hz and above 100Hz to minimize environmental signal interferences during ECG waveform processing. The software plots its interpretation of P,Q,R,S, and T for each heart beat (see below); so that spurious data resulting from unfiltered noise or motion artifacts may be rejected.
Additional product information: Mouse Specifics, Inc.
The AnonyMOUSE ECG Screening System for non-invasive measurement of ECG in the mouse.
- Lead plates: Snap-Style Pre-Gelled Plates (One Health Care Tech Inc., 8020 Tyler Blvd., Mentor, OH 44060)
- Gel-coated ECG electrodes (Red Dot; 3 M, St. Paul, MN)
- Paper towels or Terri wipe cloth
- Mild detergent
- 70% Alcohol
Acclimation to test conditions
A 10 min period of acclimatization is implemented when using the non-invasive ECG screening system because the novelty of the environment may induce a state of anxiety in conscious mice (manifested by body tremors, shivering, and general increase in activity, all of which may introduce electrical signals that confound acquisition of ECG). Two mice, one placed on each side of the tower platform, are acclimated at the same time. As the mice become acclimated to the test conditions, they tend to become more relaxed, and more likely to contact the electrode pads, which promote recordable ECG signal.
Procedure: Electrocardiograms (ECG) in conscious mice using the AnonyMouse ECG screening system
To measure electrocardiographic (ECG) parameters in conscious, unanesthetized, and unrestrained 12 wk-old mice, the AnonyMouse ECG screening system is used. The success of obtaining recordable data depends upon properly acclimatizing the mice to the testing conditions, and properly positioning the paws to be in full contact with the electrodes.
Staging mice for ECG recording
a. Mice are gently removed from their cages, picked up by their tails, and propped on the ECG platform (see Figure 3 above) with the least amount of provoked anxiety and stress and then allowed to acclimate for 10 min.
b. An acclimated mouse is then gently prodded and positioned at the center of the platform such that the paws come in contact with the three electrodes using a small wooden stick with a cotton swab on one end. The two front paws and left hind paw in contact with the lead plates with the mouse standing, not sitting, are optimized testing conditions.
c. The ECG system is then turned ON, started and operated according to manufacturer's protocol. While waiting for signals to appear, another mouse is gently placed on the vacated side of the platform to acclimate.
d. The output from the amplifier is scrutinized carefully such that only data from a continuous display of 20-30 ECG signals or waveforms (in 2-3s) are recorded and used in the analyses (see Figure 4 below).
Examples of recorded mouse ECG signals. Panel A. ECG signals from a conscious or unanesthetized mouse. Note the difficulty in determining the exact beginning and ending of the T wave. Panel B. ECG signals from an anesthetized mouse.e. At the end of each session, the tower and platform is disassembled by its various parts (shields, platform, lead plate) for cleaning using mild detergent and paper towels, and then disinfected and allowed to dry with alcohol. The lead plate wherein the electrodes are attached are kept and not thrown away, while the gel-coated ECG electrodes are periodically changed and replaced.
f. The cleaned platform is assembled for the next session. A piece of paper towel is placed beneath the back shield and on each sidewall of the platform to protect it from soiling. The distance of the back shield to the platform is adjusted according to the size, such that the closest channel to the platform is used for small to medium sized mice, and one channel farthest back is used for larger mice.ECG data analyses and definitions using e-MOUSE®
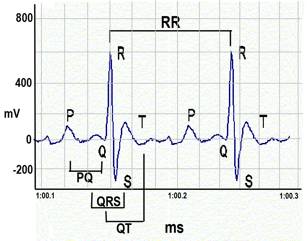
ECG waveforms.a. Heart rate is calculated using the number of R-wave peaks.
b. QRS complex is automatically determined from the beginning of a Q-wave peak to the end of the S-wave peak.
c. QT interval is defined as the segment in ECG waveform beginning at the peak of the Q-wave, including the inverted and/or biphasic portions of the T-wave, and ending at the peak of the T-wave.
d. The end of the T-wave of each ECG waveform is defined as the point where the T-wave returns to baseline or isoelectric line.
e. Isoelectric line or baseline is defined as the average voltage between the preceding P-wave and the QRS interval.
f. The QT intervals are heart rate (RR) corrected (QTc) by application of the equation recommended for use in conscious mice: QTc = QT/SQRT(RR/100)
g.
---------------------------------------------------------------------------------------------------------------------------
Bone mineral density and body composition
Workflow
DXA system prepared and calibrated Whole body scan Analysis of whole body scan images
- Top loading balance: Ohaus Portable Navigator Series Electronic, Model NV-210 (Ohaus Corp., Pine Brook, NJ) for measuring body weights.
- DXA scanning by PIXImus: The Lunar PIXImus small animal DXA system (PIXImus™, Fitchburg, WI) was used to assess whole body areal (a)BMD and body composition. This methodology has been validated in small animals (see Donahue1, and 2).
- Specimen trays with sticky immobilizing tape: Lunar PIXImus Corporation Headquarters, Madison, WI
- Needles and syringes
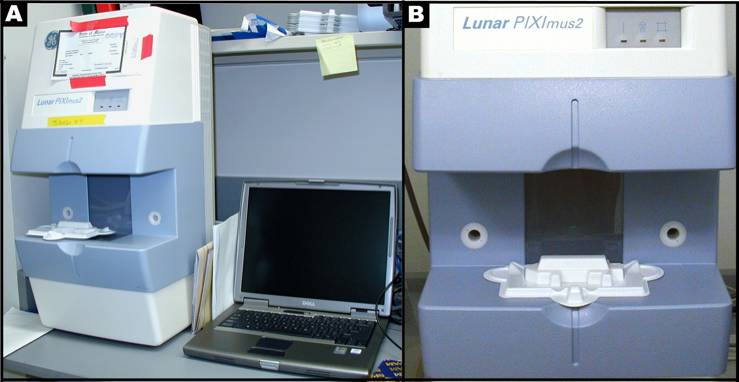
- Mouse densitometer dual energy X-ray absorptiometry (PIXImus small animal) DXA system (GE-Lunar, Madison, WI): The PIXImus mouse densitometer has been reconfigured with lower x-ray energy than in human DXA machines in order to achieve optimal contrast in small specimens. The Lunar PIXImus for rodents is a fully integrated densitometer designed for the estimation of bone mineral density (BMD) and body composition. The resolution of the PIXImus is 0.18 x 0.18 mm pixels with a usable scanning area of 80 x 65 mm, allowing for measurement of a single mouse or collections of isolated specimens. The PIXImus has been calibrated with a phantom utilizing known values, and QA is performed daily with this same phantom. The precision for BMD is less than 1% coefficients of variation (CV) for whole body, approximately 1.5% CV for specialized regions (see Donahue1, and 2). Correlation with pQCT values for 614 isolated spinal vertebrae is significant (p<0.001; r=.704). Assessment of accuracy for the PIXImus is done with a set of hydroxyapatite standards (0-2,000 mg), yielding a correlation of 0.999 between standards and PIXImus measurement of mineral. Full body scans and X-ray absorptiometry data are processed with manufacturer supplied software (Lunar PIXImus 2,vers. 2.1). For additional information: http://piximus.com/
Panel A: Lunar PIXImus2 densitometer with integrated PC computer. Panel B: Close-up detail of the densitometer with specimen tray.
- Freshly prepared solution of tribromoethanol for anesthesia
- Cleaning supplies and disinfectant
Procedures: Bone mineral density and body composition measurement using DXA PIXImus
I. Collecting image scans
PIXImus (small animal DXA system, PIXImus™, Fitchburg, WI) scanning of mice for BMC and body composition is both accurate and precise although body size must be considered when comparing inbred strains. Full body scans are obtained and X-ray absorptiometry data gathered and processed with manufacturer supplied software (version 1.43.036.008).a. The PIXImus densitometer apparatus is initially calibrated with a "phantom mouse" according to manufacturer's protocol.
b. Mice are weighed at 16 wks of age and anesthetized intraperitoneally with tribromoethanol at a dose of 0.2 mL/10g body weight.
c. Fully anesthetized mice are positioned dorso-ventral on the specimen sticky tray (body must be within blue line on the tray; tail positioned away or alongside the body, front legs extended to the side, and neck and spine gently straightened) under the PIXImus beam path (see Panel B above).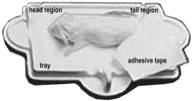
d. Trays are positioned such that the area of the head is always oriented toward the left from the investigator's point of view, and the mice are position dorso-ventra in order to scan the entire body and tail. The X-ray process to obtain a single full scan is approximately 5 min; data can be manipulated subsequently to obtain specific regions of interest (ROI's).
e. Disposable plastic trays, with sticky tape for immobilizing mice, can be saved and re-used after a thorough cleaning and disinfections.Investigator's notes: To accommodate the large scope of this project, animals are phenotyped in “rounds” beginning every three weeks, over a period of approximately 18 mo. Every effort is made to include a complete strain set within each round. To correct for seasonal effects, changes in the equipment, and differences between different mouse rooms (A vs. B), C57BL/6J males and females are included in each round for each room. See CGDpheno2 for C57BL/6J controls over time.
II. Measurement acquisition and image scan analysis
Based on PIXImus validation studies (see Donahue1, and 2) DXA-estimated measurements of fat tissue correlate well with measurements obtained from chemical extraction. This is made possible by developing software versions with equations that adequately correct raw DXA-estimated measurements.a. Following the completion of an image scan the DXA system automatically implements specialized software to identify bone tissue from either fat tissue or from lean tissue based on the resulting X-ray densities at two distinct energy levels (see Donahue1, and 2).
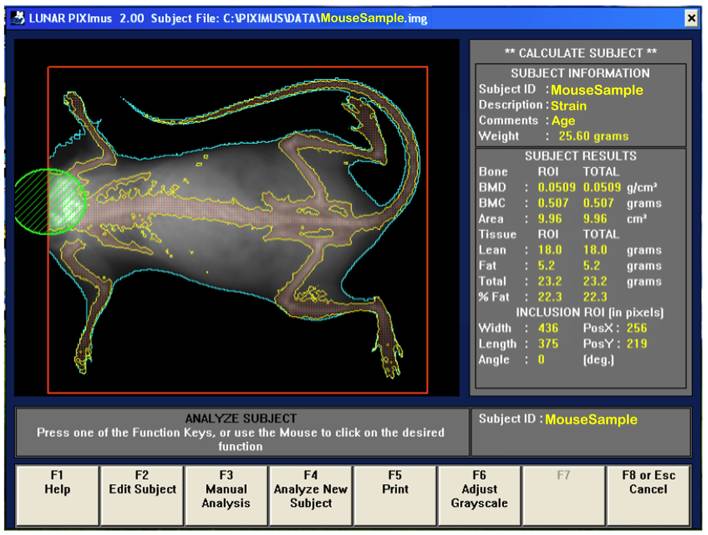
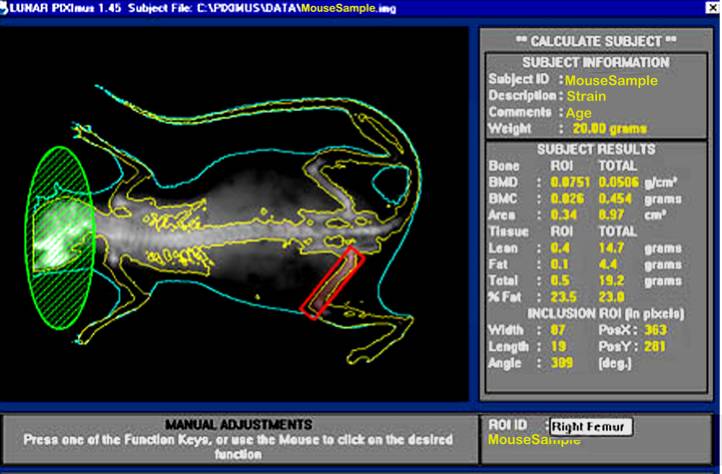
b. Visually, following the completion of a scan, the mouse sample is then outlined with red and green colored circle and square to define specific regions of interests (ROIs).
d. By using the screen interactive display, F3 is first clicked to prompt measurement adjustments, and then clicked again for the second time to adjust ROI (region of interest).
e. The area to be analyzed is defined (red box), and areas to be excluded from the calculations are defined (green). The arrow keys are used to adjust to the desired size, in addition to holding the control key down to enlarge or elongate the circle or square areas.
f. Once the desired ROI is achieved, the Enter key is clicked and resulting data measurement is displayed. By pressing F5 a hard copy of the image and the scan analysis result is printed.
g. To prompt the computer to finish the session, F8 or Esc key is clicked once, and then clicked again to return to the main menu screen where the next subject to be tested begin.
h. Acquired data is saved on the hard drive and on a zip or CD disk for later archiving.Safety
For safety, gloves must be worn and radiation safety guidelines strictly adhered to, such that technicians must be 6 feet away from the PIXImus machine during scanning.
ROI = Region of interest
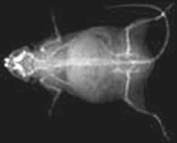
Bone area measurement is generated by outlining or specifying the limits or dimensions of the entire skeletal bone regions of the body (yellow outline in figure below), excluding the head (green), as regions of interest (ROI, red) following a full body X-ray scan.
Bone mineral content (BMC) is generated from PIXImus density scans which are assessed for accuracy using a set of 0.0 mg to 2,000 mg of hydroxyapatite standards. According to the DXA system, bone mineral content (measured as the attenuation of the X-ray by the bones being scanned) is divided by the area (also measured by the machine) of the site being scanned to obtain bone mineral density (BMD):
BMC = Bone mineral content (g)
BMD = Bone mineral density = BMC ÷ Area (g/cm2)
Fat tissue mass = all tissues with low density (x-ray scan)
Lean tissue mass = Total body tissue mass - Fat tissue mass
% Fat = (Fat tissue mass ÷ Total body tissue mass ) x 100
--------------------------------------------------------------------------------------------------------------------------
Data collected by investigators
hematology — cell counts
- red blood cell count (RBC; per volume x 106)
- white blood cell count (WBC; per volume x 103)
- basophil differential (percent of total WBC)
- eosinophil differential (percent of total WBC)
- lymphocyte differential (percent of total WBC)
- monocyte differential (percent of total WBC)
- neutrophil differential (percent of total WBC)
- large unstained cells (percent of total WBC)
- platelet count (PLT; units per volume x 103)
- reticulocyte differential (percent of total RBC)
erythrocyte parameters
- RBC corpuscular distribution width (RDW)
- mean RBC corpuscular volume (MCV)
- hemoglobin concentration distribution width (HDW)
- mean RBC corpuscular hemoglobin content (MCH)
- mean RBC corpuscular hemoglobin concentration (MCHC)
- measured hemoglobin (mHGB)
- calculated hemoglobin (cHGB)
- mean platelet volume (MPV)
- hematocrit (HCT)
blood pressure
- pulse rate
- systolic blood pressure
clinical chemistry
- glucose (plasma GLU, 4h fast)
- HDL cholesterol (plasma HDL)
- total cholesterol (plasma CHOL)
- triglycerides (plasma TG)
electrocardiography (ECG)
- heart rate (HR)
- coefficient of variance (CV)
- mean R amplitude (Rampl)
- mean SR amplitude (SRAmpl)
- PQ interval (PQ)
- QT interval (QT)
- difference between smallest and largest QT interval (QTD)
- rate corrected QT interval (QTC)
- rate corrected QT dispersion (QTCD)
- interval between peak of P-wave and R-wave (PR)
- interval between start and end of QRS complex (QRS)
- R to R interval (RR)
body composition without head
- whole body bone mineral density
- whole body bone mineral content
- whole body bone area
- calculated lean tissue mass
- calculated total tissue mass
- percent fat
- body weight