Xing1 project protocol
Aging study: Electrocardiogram for 29 inbred strains of mice (2008)
Xing S, Korstanje R, Paigen BWith: Schultz D, Godfrey D
Project protocol — Contents
Workflow and sampling
Equipment
Reagents, supplies, and solutions
Procedure: Electrocardiograms (ECG) in conscious mice using the AnonyMouse ECG screening system
Definitions
Data
References
Workflow
The platform is cleaned prior to each test session AnonyMOUSE ECG Screening System, for non-invasively recording electrocardiograms in conscious mice (Mouse Specifics, Inc. 28 State St., Suite 1112, Boston, MA 02109)
AnonyMOUSE® ECG Screening System
An array of gel-coated ECG electrodes (Red Dot; 3 M, St. Paul, MN) are embedded in the platform floor and spaced approximately 3 cm in between each other such that forelimb and hindlimb paws can simultaneously come in contact with the electrodes. Filter papers, with openings for the electrodes, are used to prevent mouse urine from short-circuiting the signals. The electrodes are connected to an amplifier (HP78901A, Hewlett-Packard, Andover, MA) by a shielded 3-electrode lead set (M1605A Snap, Hewlett-Packard, Andover, MA). The signals are digitized with 16-bit precision (DI-220, DATAQ Instruments, Inc., Akron, OH) at a sampling rate of 2500 samples/s.
Data are transmitted to the mousespecifics.com web site (Mouse Specifics, Inc., Boston, MA) using standard file-transfer protocols for ECG signal analyses by e-MOUSE®. e-MOUSE®, an internet-based physiologic waveforms analysis portal, incorporates Fourier analyses and linear time-invariant digital filtering of frequencies below 2Hz and above 100Hz to minimize environmental signal interferences during ECG waveform processing. The software plots its interpretation of P,Q,R,S, and T for each heart beat (see below); so that spurious data resulting from unfiltered noise or motion artifacts may be rejected.
Additional product information: Mouse Specifics, Inc.
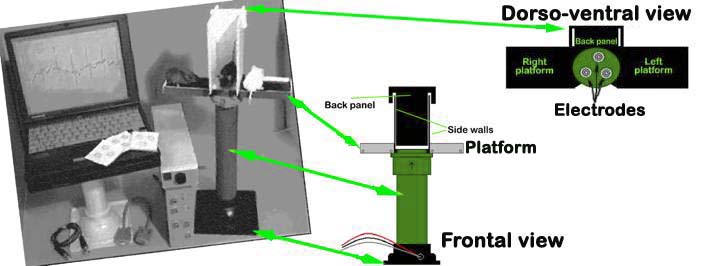
Figure 3. The AnonyMOUSE ECG Screening System for non-invasive measurement of ECG in the mouse.
Shielded 3-electrode lead set (M1605A Snap, Hewlett-Packard, Andover, MA)
- Lead plates: Snap-Style Pre-Gelled Plates (One Health Care Tech Inc., 8020 Tyler Blvd., Mentor, OH 44060)
- Gel-coated ECG electrodes (Red Dot; 3 M, St. Paul, MN)
- Paper towels or Terri wipe cloth
- Mild detergent
- 70% Alcohol
Acclimation to test conditions
A 10 min period of acclimatization is implemented when using the non-invasive ECG screening system because the novelty of the environment may induce a state of anxiety in conscious mice (manifested by body tremors, shivering, and general increase in activity, all of which may introduce electrical signals that confound acquisition of ECG). Two mice, one placed on each side of the tower platform, are acclimated at the same time. As the mice become acclimated to the test conditions, they tend to become more relaxed, and more likely to contact the electrode pads, which promote recordable ECG signal.
Procedure: Electrocardiograms (ECG) in conscious mice using the AnonyMouse ECG screening system
To measure electrocardiographic (ECG) parameters in conscious, unanesthetized, and unrestrained 11wk-old mice, the AnonyMouse ECG screening system is used. The success of obtaining recordable data depends upon properly acclimatizing the mice to the testing conditions, and properly positioning the paws to be in full contact with the electrodes.
Staging mice for ECG recording
a. Mice are gently removed from their cages, picked up by their tails, and propped on the ECG platform (see Figure 3 above) with the least amount of provoked anxiety and stress and then allowed to acclimate for 10 min.
b. An acclimated mouse is then gently prodded and positioned at the center of the platform such that the paws come in contact with the three electrodes using a small wooden stick with a cotton swab on one end. The two front paws and left hind paw in contact with the lead plates with the mouse standing, not sitting, are optimized testing conditions.
c. The ECG system is then turned ON, started and operated according to manufacturer's protocol. While waiting for signals to appear, another mouse is gently placed on the vacated side of the platform to acclimate.
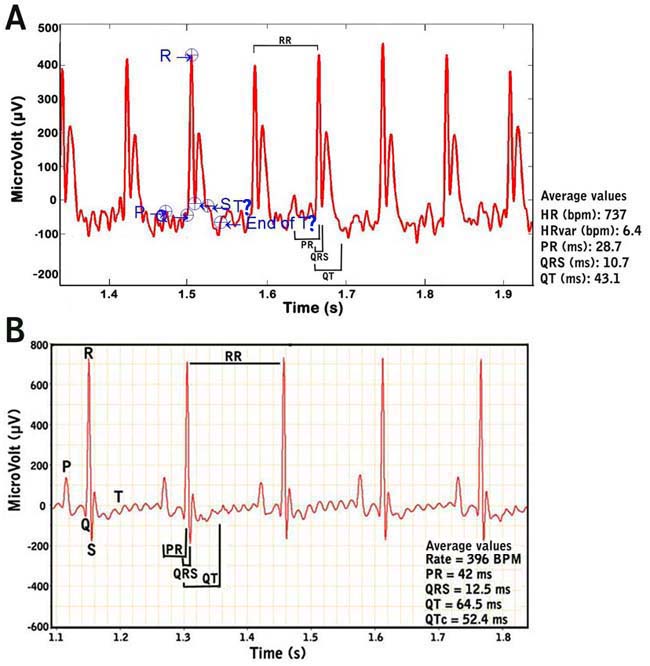
d. The output from the amplifier is scrutinized carefully such that only data from a continuous display of 20-30 ECG signals or waveforms (in 2-3s) are recorded and used in the analyses (see Figure 4 below).
Figure 4. Examples of recorded mouse ECG signals. Fig. 4A. ECG signals from a conscious or unanesthetized mouse. Note the difficulty in determining the exact beginning and ending of the T wave. Fig. 4B. ECG signals from an anesthetized mouse.e. At the end of each session, the tower and platform is disassembled by its various parts (shields, platform, lead plate) for cleaning using mild detergent and paper towels, and then disinfected and allowed to dry with alcohol. The lead plate wherein the electrodes are attached are kept and not thrown away, while the gel-coated ECG electrodes are periodically changed and replaced.
f. The cleaned platform is assembled for the next session. A piece of paper towel is placed beneath the back shield and on each sidewall of the platform to protect it from soiling. The distance of the back shield to the platform is adjusted according to the size, such that the closest channel to the platform is used for small to medium sized mice, and one channel farthest back is used for larger mice.ECG data analyses and definitions using e-MOUSE®
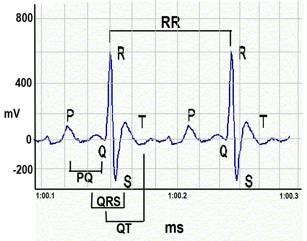
Figure 5. ECG waveforms.a. Heart rate is calculated using the number of R-wave peaks.
b. Heart rate variability is calculated as the average of the differences between a given series of heart rates from a set of ECG signals or waveforms.
c. QRS complex is automatically determined from the beginning of a Q-wave peak to the end of the S-wave peak.
d. QT interval is defined as the segment in ECG waveform beginning at the peak of the Q-wave, including the inverted and/or biphasic portions of the T-wave, and ending at the peak of the T-wave.
e. The end of the T-wave of each ECG waveform is defined as the point where the T-wave returns to baseline or isoelectric line.
f. Isoelectric line or baseline is defined as the average voltage between the preceding P-wave and the QRS interval.
g. The QT intervals are heart rate (RR) corrected (QTc) by application of the equation recommended by Mitchell et al. for use in conscious mice: QTc = QT/SQRT(RR/100)
h. For additional information:Data collected by investigator
Electrocardiographic (ECG) waveforms, ECG waveform intervals (RR, PR, QRS complex, QT, ST), and heart rates.
References
Chu V, Otero JM, Lopez O, Morgan JP, Amende I, Hampton TG. Method for non-invasively recording electrocardiograms in conscious mice. BMC Physiol. 2001;1(1):6.
PubMed 11476671 Chu V, Otero JM, Lopez O, Sullivan MF, Morgan JP, Amende I, Hampton TG. Electrocardiographic findings in mdx mice: a cardiac phenotype of Duchenne muscular dystrophy. Muscle Nerve. 2002 Oct;26(4):513-9.
PubMed 12362417 Desai KH, Sato R, Schauble E, Barsh GS, Kobilka BK, Bernstein D. Cardiovascular indexes in the mouse at rest and with exercise: new tools to study models of cardiac disease. Am J Physiol. 1997 Feb;272(2 Pt 2):H1053-61.
PubMed 9124413 Mitchell GF, Jeron A, Koren G. Measurement of heart rate and Q-T interval in the conscious mouse. Am J Physiol. 1998 Mar;274(3 Pt 2):H747-51.
PubMed 9530184