Maurer1 project protocol
Drug study: Cardiovascular response to beta-adrenergic blockade or activation in males of 23 inbred strains of mice (2009)
Maurer F, Beckmann J, Abriel H, Pedrazzini TWith: Berthonneche C, Peter B, Schüpfer F, Hayoz P, Kutalik Z, Bergmann S,
Project protocol — Contents
Workflow and sampling
Workflow and sampling
Equipment and supplies
Reagents and solutions
Procedure: Blood pressure and pulse analysis using the Visitech BP-2000 system
Procedure: Electrocardiograms (ECG) in anesthetized mice
Definitions
Data
ReferencesWorkflow
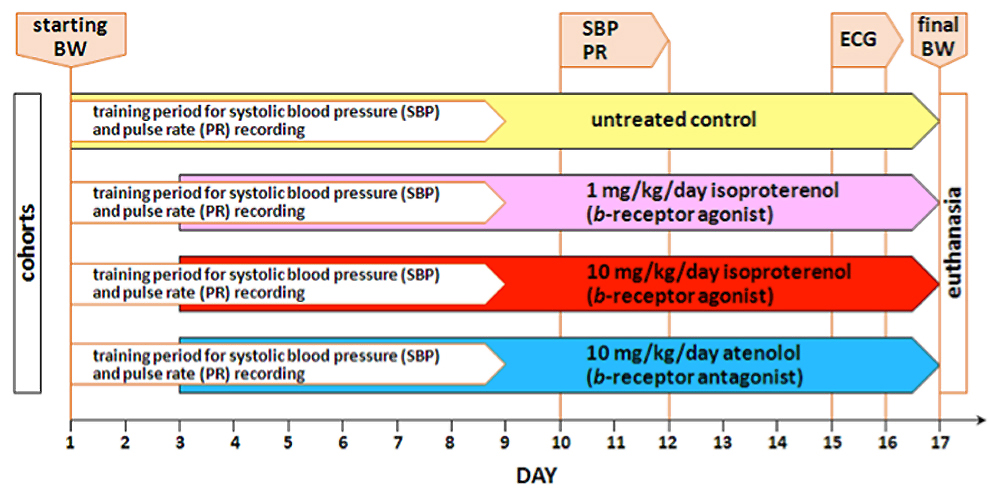
Day Procedure accomplished ß-adrenergic Rx dose Equipment Data collected All cohorts of mice acclimated for at least 1 week to testing facility Starting body weight (BW) measured All cohorts of mice trained for 1-wk for systolic blood pressure (SBP) and heart rate (HR) recording Visitech BP-2000 tail cuff system Start treatment regimen lasting 2-wks, except controls 1 or 10 mg/kg per day isoproterenol, or 10 mg/kg per day of atenolol balance scale, mini-osmotic pump Following 1-wk of training, systolic blood pressure and pulse rates from each mouse are measured 1 or 10 mg/kg per day isoproterenol, or 10 mg/kg per day of atenolol Visitech BP-2000 tail cuff system SBP, HR by tail cuff Mice anesthetized with halothane for ECG waveforms measurements 1 or 10 mg/kg per day isoproterenol, or 10 mg/kg per day of atenolol ECG system and software (EMKA) HR by ECG, ECG wave form recordings Ending body weight measured and heart harvested; atria and ventricles dissected and weighed balance scale, dissecting kit body weight, heart weight, atria weight, ventricles weight ECG waveforms analyzed using dedicated ECG software computer and ECG software analysis ECG peak intervals, amplitudes and areas
Figure 1. Schematic layout of the experimental workflow.
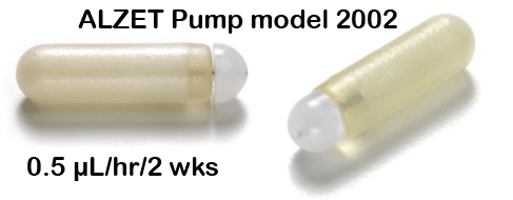
- Subcutaneous implantable osmotic mini-pumps (Alzet, model 2002, Charles River Laboratories)
- Blood pressure via tail cuff system: Visitech BP-2000 (Cary, NC)
- IOX 1.7.0 and ECG-Auto 1.5.7 software (EMKA Technologies).
- Gas anesthetic delivery system for small rodents
- Small rodent dissecting kit with heavy duty (decapitating) scissors
- -70°C Freezer
- Dissecting microscope
- Set of thermometers
- Liquid nitrogen for freezing tissues at -70°C
- Computer
- Blotting absorbent paper
- Paper towels or Terri wipe cloth
- Atenolol (10 mg/kg/day dose, Sigma-Aldrich)
- Isoproterenol (1 or 10mg/kg/day doses, Sigma-Aldrich)
- Rodent anesthesia: halothane
- 0.9% NaCl for control treatment
- Ice-cold phosphate buffered saline (PBS)
- Mild detergent
- 70% alcohol
Acclimation to test conditions
Mice are acclimatized to the testing facility for at least 3 days.
Procedure: Blood pressure and pulse analysis using the Visitech BP-2000 system
I-Pre-treatment and pre-testing procedure
a. Following facility acclimation, starting body weight (BW) for each male mouse from 23 inbred strains is measured.
b. Mice are trained for 1-wk using the Visitech BP-2000 system same time (2-5 pm) during the day.
c. On the 3rd day following measurement of the starting body weight, each mouse is assigned to one of 4-cohorts (~10 mice/cohort).
d. Osmotic mini-pumps (see Figure 2 below) are implanted subcutaneously under anesthesia in the treated cohorts and not in the control cohort.
e. Each mouse in the treated cohorts is administered β-adrenergic drug of either 10 mg/kg per day of atenolol, or 1 or 10 mg/kg per day of isoproterenol.
f. β-adrenergic treatments are delivered chronically for 2 consecutive weeks.
Figure 2. Subcutaneous implantable mini-osmotic pump for administering β-adrenergic drugs.II-Essential checklist
a. Specimen platforms are set at exactly at 38°C for maintaining core body temperature during testing (VERY IMPORTANT). After enough time is allowed for temperature to stabilize, the correct temperature should register when measured in the middle of the heating platform. Failure to do so, not only compromises the results, but also may be fatal to mice in cases of hyperthermia (especially small mice).
b. Long 5-6" balloons are cut into 4 equal sections of 1 1/3" pieces. These balloon pieces are then installed and threaded through the tail-cuffs. Without stretching the balloons, they are shrunk and customized to fit the tail-cuffs with the use of a heat gun or a lighter.
c. The balloons are checked for holes by pumping air into the tail-cuffs at pressures not greater than 200 mm Hg that remain stable over a given time. In the event that the observed pressure is steadily lost, air is pumped up again and the balloon with the hole is systematically identified using a pair of smooth tubing clamp (not hemostats or forceps as they may damage the tubing) and then replaced.
d. Pressure is calibrated according to manufacturer's protocol. Briefly, by connecting directly the air supply tube to the sphygmomanometer, and inputting the values observed in the attached mercury column, these pressure calibrations are then compared with those displayed on the computer following inflations of the tail-cuff balloons at appropriate pressures.
Figure 3. The Visitech System for blood pressure and pulse measurements in mice.
Figure 4. Mice positioned for blood pressure measurement using tail-cuff method.III- Obtaining pulse and blood pressure measurements
a. On day 10, 11, or 12 fully acclimated and trained mice are picked up by their tails and gently placed on a temperature-stabilized (38°C) platform. At least two thermometers are taped in the middle and on the side of the platform and covered with magnetic restrainers to provide additional means to monitor and to assure proper platform temperature.
b. The mice are then restrained in place (without anesthesia) using magnetized holders. Care is taken to prevent the feet from getting pinched by the magnets.
c. To facilitate measurement efficiency, automated 4-stage sphygmomanometers for mice are used to test 4 mice simultaneously in a given session.
d. Once the mice are properly secured, their tails are then passed through the cuffs and the optical hemodrometers, and the exposed proximal tail segments are fixed in place with bandage tape.
e. The mice may be left in the optical position for 5-10 min to promote body temperature stabilization. Any evidence of mouse sweating during measurement is noted, for it is likely indication of non-optimal or un-regulated temperature.
f. The tail-cuff system is then turned ON to begin the process; air is automatically pumped into the balloons, consequently applying pressure on the tail vessels, so that waveforms of blood vessel expansions and contractions can be optically sensed and recorded.
g. Simultaneous recording of systolic blood pressure, diastolic blood pressure, and pulse rate measurements are automatically recorded at least 30 times per session.
h. After all the data are collected and saved, the bandage tapes are gently removed from the tail so that mice are able to come out on their own off their restraints to be returned to their respective cages. The whole process is executed with the least amount of stress to the mice, while providing them an opportunity to calm down as well.
i. At the end of each session the platforms are cleaned with wet paper towel and then disinfected with alcohol.Procedure: Electrocardiograms (ECG) in anesthetized mice
Measurements of systolic blood pressure and pulse rate are obtained from unanesthetized/conscious ~7-13 wk-old male mice from all 4 cohorts (control, iso1, iso10, ate) with minimal restraint using the Visitech BP-2000 system. The Visitech BP-2000 system is a non-invasive blood pressure and pulse analyzer that can accommodate 4 mice simultaneously per session. In order to obtain consistency in the results, mice are first conditioned in the system setup the same time everyday for at least 1 wk prior to recorded measurements.Recording electrocardiograph (ECG) waveforms under anesthesia
a. On day 15, 16, or 17 chronically treated mice and the untreated control are prepared for halothane gas anesthesia for subsequent ECG recording.
b. Gas anesthetic maintenance is achieved by monitoring heart rates above 300 beats/min, and depth of sedation via the absence of pedal reflex.
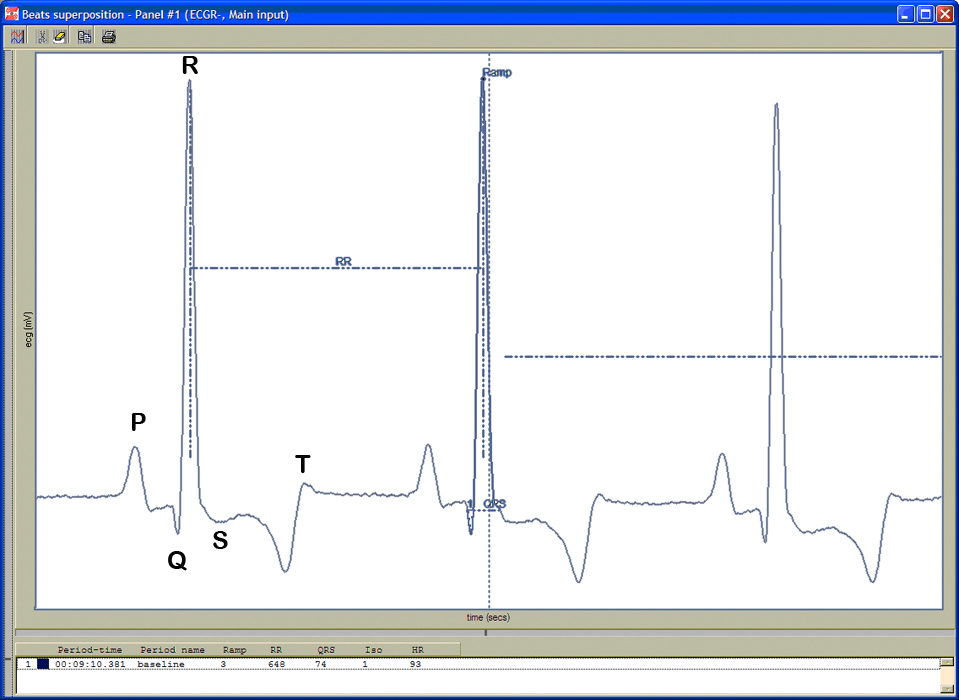
Figure 5. ECG waveforms.c. Electrocardiograms (ECG) are recorded in unconscious-fully sedated mice using the IOX 1.7.0 and ECG-Auto 1.5.7 softwares.
d. Heart rate is automatically calculated using the number of R-wave peaks/min.
e. QRS complex is automatically determined from the beginning of a Q-wave peak to the end of the S-wave peak (see Figure 5 above).
f. QT interval is defined as the segment in ECG waveform beginning at the peak of the Q-wave, including the inverted and/or biphasic portions of the T-wave, and ending at the peak of the T-wave.
g. The end of the T-wave of each ECG waveform is defined as the point where the T-wave returns to baseline or isoelectric line.
h. Isoelectric line or baseline is defined as the average voltage between the preceding P-wave and the QRS interval.
i. The QT intervals are heart rate (RR) corrected (QTc) by application of the equation recommended by Mitchell et al. for use in conscious mice: QTc = QT/SQRT(RR/100)IV - Morphometric measurements
a. On day 16 or 17, mice are weighed and sacrificed by decapitation.
b. Hearts are rapidly excised from the mice, rinsed in ice-cold phosphate buffered saline (PBS) solution, and blotted dry.
c. Cardiac atria and ventricles are carefully dissected under a dissecting microscope, and then weighed separately. These tissues are subsequently frozen in liquid nitrogen and stored at -70°C.
d. For each strain, an average of 10 mice per experimental condition (control, ate, iso1 and iso10) are evaluated across all phenotypes.Investigator's notes on criteria to exclude animals from downstream analyses:
a. Either starting BW of the animal was more than 4 SD away from the mean of starting BW of the corresponding strain.
b. Or the ending BW of the animal was more than 4 SD away from the mean ending BW of the corresponding strain in the corresponding drug condition.Investigator's notes where missing data are found:
a. The mouse died during the experiment (in such cases, only the starting BW values were kept in the data file and analyses).
b. Starting BW was not measured (i.e. for several of the BALB/cByJ, FVB/NJ, and C3H/HeOuJ individuals).
c. Proper HR and/or SBP values could not be recorded by tail-cuff: this occurred either when mice were too agitated to get good records, or when marked pigmentation of the tail blunted signals (for instance in BTBR mice).
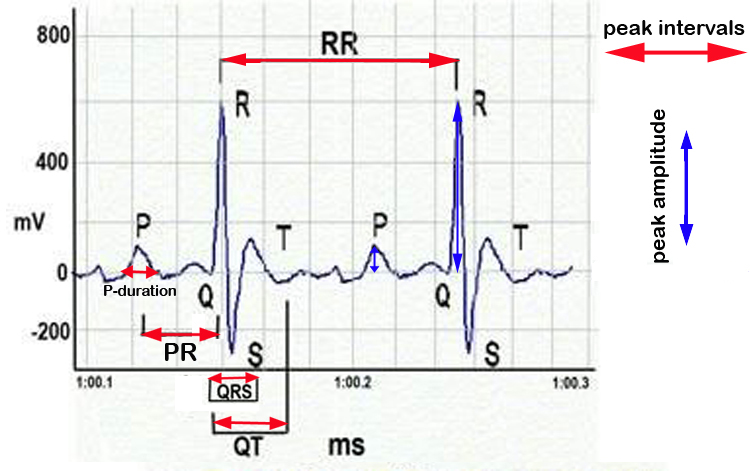
d. ECGs were or could not be recorded properly: for instance ECGs were not recorded in several BALB/cByJ individuals. Occasionally, anaesthetized mice were still a bit agitated and smooth profiles could not be obtained.ECG peak area = peak amplitude X peak interval
Figure 6. Schematic representation of ECG waveforms and cardiac parameters.fold change in body weight = final or ending body weight ÷ starting body weight
normalized heart weight = gross heart weight ÷ final body weight [mg/g]
atria index (normalized atria weight) = gross atria weight ÷ final body weight [mg/g]
ventricle index (normalized ventricle weight) = gross ventricle weight ÷ final body weight [mg/g]
atria to ventricle ratio = gross atria weight ÷ gross ventricle weight
systolic blood pressure: blood pressure during peak cardiac contraction. tail pulse: throbbing of the tail arteries as a consequence of heartbeat.
Data collected by investigator
- Unconscious electrocardiograph (ECG) waveforms, ECG waveform intervals (P duration, RR, PR, QRS complex, QT, ST), peak (P, Q, R, S) amplitudes, peak (S, QRS, QT) areas, and heart rates.
- Conscious pulse rate, and systolic blood pressure.
- Body weights at the start and end of the study.
- Heart morphometrics: heart weight, atria (both left and right) weight, ventricles (both left and right) weight.
References
Krege JH, Hodgin JB, Hagaman JR, Smithies O. A noninvasive computerized tail-cuff system for measuring blood pressure in mice. Hypertension. 1995 May;25(5):1111-5.
PubMed 7737724 Mitchell GF, Jeron A, Koren G. Measurement of heart rate and Q-T interval in the conscious mouse. Am J Physiol. 1998 Mar;274(3 Pt 2):H747-51.
PubMed 9530184 Mongue-Din H, Salmon A, Fiszman MY, Fromes Y. Non-invasive restrained ECG recording in conscious small rodents: a new tool for cardiac electrical activity investigation. Pflugers Arch. 2007 Apr;454(1):165-7Epub 2007 Jan 17.
PubMed 17226051 Sugiyama F, Churchill GA, Li R, Libby LJ, Carver T, Yagami K, John SW, Paigen B. QTL associated with blood pressure, heart rate, and heart weight in CBA/CaJ and BALB/cJ mice. Physiol Genomics. 2002 Jul 12;10(1):5-12.
PubMed 12118100 Thireau J, Zhang BL, Poisson D, Babuty D. Heart rate variability in mice: a theoretical and practical guide. Exp Physiol. 2008 Jan;93(1):83-94. Epub 2007 Oct 2.
PubMed 17911354