Svenson4 project protocol
Bone mineral density and body composition in C57BL/6J-Chr#PWD/Ph/ForeJ mouse chromosome substitution strains (2006)
Svenson KL, Forejt J, Donahue L, Paigen BWith: Marion M
Project protocol — Contents
Workflow and sampling
Equipment
Reagents, supplies, and solutions
Procedure for mouse densitometry using the DXA system
Data
ReferencesWorkflow
Body weight measurements Mice scanned and images collected Measurement acquisition and image scan analysis
- Balance scale
- Mouse densitometer dual energy X-ray absorptiometry (PIXImus small animal)
- DXA system (LUNAR, Madison, WI), software version 1.43.036.008): The PIXImus mouse densitometer has been reconfigured with lower x-ray energy than in human DXA machines in order to achieve optimal contrast in small specimens.
The Lunar PIXImus for rodents is a fully integrated densitometer designed for the estimation of bone mineral density (BMD) and body composition.
The resolution of the PIXImus is 0.18 x 0.18 mm pixels with a usable scanning area of 80 x 65 mm, allowing for measurement of a single mouse or collections of isolated specimens.
The PIXImus has been calibrated with a phantom utilizing known values, and a QA is performed daily with this same phantom.
The precision for BMD is less than 1% coefficient of variations (CV) for whole body, approximately 1.5% CV for specialized regions (Nagy et al, 2000). Correlation with peripheral quantitative computed tomography (pQCT) values for 614 isolated spinal vertebrae is significant (p<0.001; r=.704).
Assessment of accuracy for the PIXImus is done with a set of hydroxyapatite standards (0-2,000 mg), yielding a correlation of 0.999 between standards and PIXImus measurement of mineral.
For additional information on Lunar PIXImus
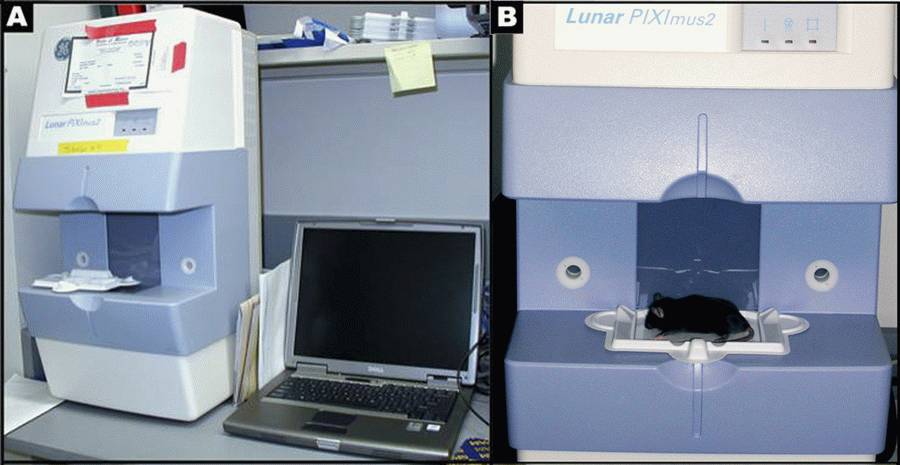
Figure A: Lunar PIXImus2 densitometer with integrated PC computer. Figure B: Close-up detail of the Lunar PIXImus2 densitometer with specimen tray.
- Disposable specimen trays with sticky immobilizing tape: Lunar PIXImus Corporation (Madison, WI 53717)
- Cleaning solution
Acclimation to test conditions
In general all mice are brought into the procedure room and are tested within 1 h.
Procedure for mouse densitometry using the DXA system
I. Collecting image scans
a. The PIXImus densitometer apparatus is first calibrated with a "phantom mouse" according to manufacturer's protocol.
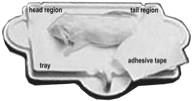
b. Then each mouse is placed on the specimen sticky tray (body must be within blue line on the tray) under the PIXImus beam path. The tail is placed alongside the body, the front legs are extended to the side, and the neck and spine are gently straightened.c. Trays are positioned so that the area of the head is always oriented toward the left from the investigator's point of view, and the mice are positioned dorso-ventral so that the entire body and tail are measured in the scan.
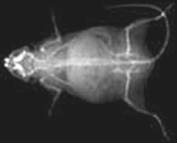
d. The X-ray process to obtain a single full scan is approximately 5 min; specific regions of interest (ROI) are then subsequently defined.e. Disposable plastic trays, with sticky tape for immobilizing mice, can be saved and re-used after a thorough cleaning and disinfecting.
II. Measurement acquisition and image scan analysis
a. Based on PIXImus validation studies (Nagy, 2000; Johnston, 2005) DXA-estimated measurements of fat tissue correlate well with measurements obtained from chemical extraction. This is made possible by developing software versions with equations that adequately correct raw DXA measurements.
b. Following the completion of an image scan the DXA system automatically implements specialized software to identify bone tissue from either fat tissue or from lean tissue based on the resulting X-ray densities at two distinct energy levels (Pietrobelli, 1996; Johnston, 2005).
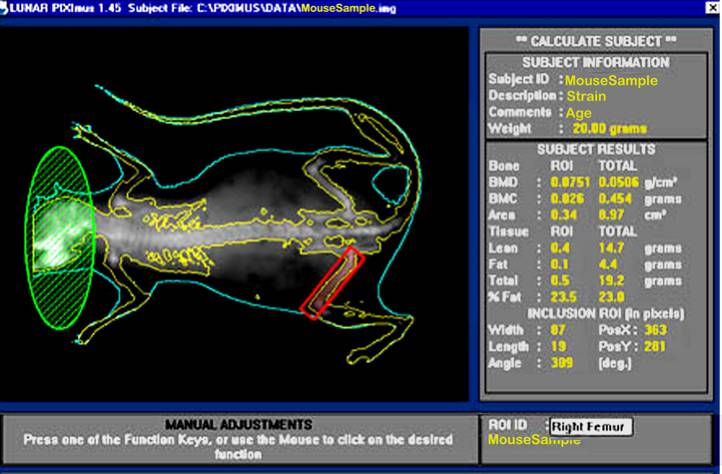
c. Visually, following the completion of a scan, the mouse sample is then outlined with red and green colored circle and square to define specific regions of interest.
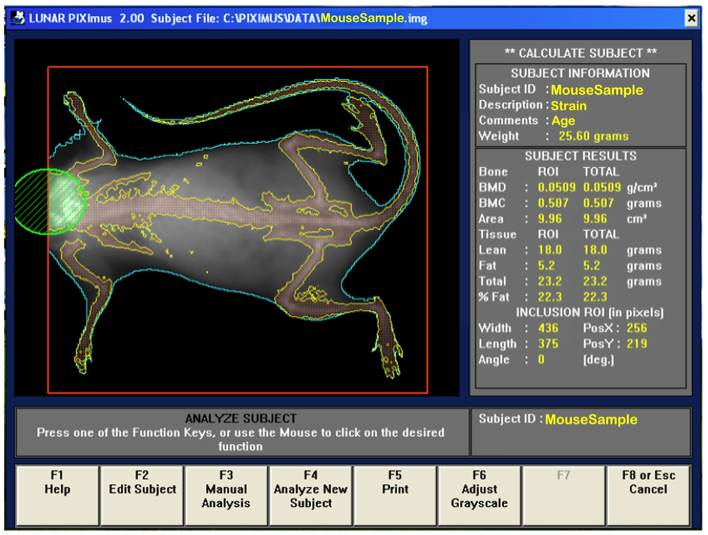
d. By using the screen interactive display, F3 is first clicked to prompt measurement adjustments, and then clicked again for the second time to adjust ROI (region of interest).
e. The area to be analyzed is defined (red box), and areas to be excluded from the calculations are defined (green). The arrow keys are used to adjust to the desired size, in addition to holding the control key down to enlarge or elongate the circle or square areas.
f. Once the desired ROI is achieved, the Enter key is clicked and resulting data measurement is displayed. By pressing F5 a hard copy of the image and the scan analysis result is printed.
g. To prompt the computer to finish the session, F8 or Esc key is clicked once, and then clicked again to return to the main menu screen where the next subject to be tested begin.
h. Acquired data is saved on the hard drive and on a zip or CD disk for later archiving.Safety
For safety, gloves must be worn and radiation safety guidelines are strictly adhered to, such that technicians must be behind portable shields or 6 feet away from the PIXImus machine during scanning. A dosimetry badge and ring must also be worn. Since both the PIXImus unit and the computer present icons that indicate the "ON" status of the X-ray tube with open shutters, precautions and any possibility of exposure should be avoided.
Definitions & formulas
Bone area measurement is generated by outlining or specifying the limits or dimensions of the entire skeletal bone regions of the body (limbs, neck, spine, and tail), excluding the head, as regions of interest (ROI) following a full body X-ray scan.
Bone mineral content (BMC) is generated from PIXImus density scans which are assessed for accuracy using a set of 0.0 mg to 2,000 mg of hydroxyapatite standards. According to the DXA system, bone mineral content (measured as the attenuation of the X-ray by the bones being scanned) is divided by the area (also measured by the machine) of the site being scanned to obtain bone mineral density (BMD):
BMD = BMC/bone area
Lean body (non-fat) tissue mass = (Total body tissue mass – body fat mass)
Percent of tissue mass that is fat = [(Total body tissue mass - lean body tissue mass) ÷ Total body tissue mass] x 100
Total body tissue mass = (BMC + Body fat tissue mass + Lean body tissue mass )
Data collected by investigator
- body composition
- percent of tissue mass that is fat
- lean body tissue mass
- total body tissue mass
- bone density and content — whole body (head excluded)
- bone mineral density (BMD)
- bone mineral content (BMC)
- total body area without head
- body length (tip of nose to base of tail)
- whole body bone area (head excluded)
- body mass index (BMI)
- body weight
References
|
Lippi G, Salvagno GL, Solero GP, Franchini M, Guidi GC. Stability of blood cell counts, hematologic parameters and reticulocytes indexes on the Advia A120 hematologic analyzer. J Lab Clin Med. 2005 Dec;146(6):333-40.
Peters LL, Cheever EM, Ellis HR, Magnani PA, Svenson KL, Von Smith R, Bogue MA. Large-scale, high-throughput screening for coagulation and hematologic phenotypes in mice. Physiol Genomics. 2002 Dec 3;11(3):185-93.
Svenson KL, Von Smith R, Magnani PA, Suetin HR, Paigen B, Naggert JK, Li R, Churchill GA, Peters LL. Multiple trait measurements in 43 inbred mouse strains capture the phenotypic diversity characteristic of human populations. J Appl Physiol. 2007 Jun;102(6):2369-78. Epub 2007 Feb 22.
|