Rusyn5 project protocol
Drug study: High-fat diet plus subchronic alcohol-induced effects in males of 14 inbred strains of mice (2011)
Rusyn IWith: Tsuchiya M, Ji C, Kosyk O, Shymonyak S, Melnyk S, Kono H, Tryndyak V, Muskhelishvili L, Pogribny IP, Kaplowitz N, Gatti DM, Kawaguchi A, Lam TC, Uehara T, Wright FA
Project protocol â Contents
Workflow and sampling
Equipment and supplies
Reagents and solutions
Procedures
Definitions and calculations
Data
References
Workflow
Mice weighed then fasted for 24h Mice anesthetized followed by surgical intra-gastric intubation; 1-wk recovery with ad libitum food and water; individually housed in metabolic cages for duration of testing Cohort1: high-fat diet only (HFD)
Cohort2: high-fat diet with EtOH (HFD_EtOH); alcohol delivered at 17.3 g/kg/d, increased 1.3 g/kg every 2 days until day 8; dose raised by 1.2 g/kg every 4 days until 27 g/kg/d reached.
Diets administered via gastric cannula; mice monitored at least 4 times daily; urine collected daily
-
17.3, 18.6, 19.9, 21.2, 22.5, 23.7, 24.9, 26.1, 27.0
cannula, peristaltic pump
-
Mice sacrificed, terminal blood collected, and liver harvested Histological evaluation, biochemical measurements, Western blot analysis, RNA isolation and gene expression analysis Gastric cannulation
- Small rodent surgical pack (scalpel, forceps, scissors, etc.) and dissecting kit
- 5-0 silk suture, 7-0 Dacron suture
- Flanged button (Instech Laboratories, Plymouth Meeting, PA, USA)
- Spring coil (Instech Laboratories)
- Swivel (Lomir Biomedical, Quebec, Canada)
- 45-cm PE-90 polyethylene tubes (Becton Dickinson, Sparks, MD, USA) with small silicon tip (1.5mm)
- Peristaltic pump (Harvard Apparatus, Natic, MA, USA)
Liver tissue and blood (serum & plasma) sample collection and storage
- Balance scale
- Needles and syringes
- Freezer-safe/crayostat storage tubes
- Disposable flint glass tubes (13 x 100 mm) with plain end (Fisherbrand) specially annealed to reduce breakage along stress point; round bottom; smooth top and bottom prevent cuts
- Centrifuge, tabletop
- Freezer: -80°C and -20°C
Histopathology
- Histology slides
- Microtome and histology sample processor
- Microscope with 100x objective and image capture capability
Protein, lipid, and metabolite extraction
- Sonicator, tissue disrupter
- 0.2 µ filter (PGC Scientific, Frederick, MD USA
- pH meter
HPLC, spectrophotometer, thermocycler
- 96-well plates
- Reverse phase C18 NBS column(5 µ; 4.6 3 150 mm; MCM, Inc., Tokyo, Japan) from ESA, Inc. (Chelmsford, MA USA).
- Beckman autosampler model 507E (Beckman Inst. Inc., Fullerton, CA USA)
- High-performance liquid chromatography (HPLC) system with fluorescence detection
- Syrbon/Barusted NANOpure II (Boston, MA)
- C18 Sep-Pak cartridges (Millipore Corp., Milfold, MA)
- Blood chemistry analyzer: Automatic Chemical Analyzer, Johnson & Johnson's VT250
- Spectrophotometer microplate reader: Beckman Coulter, DTX880
- Scanning (blots): Odyssey system, LiCor
- ImageJ (NIH, Bethesda, MD) used to quantify intensity of protein bands.
- NanoDrop ND-1000 spectrophotometer (NanoDrop Technologies, Wilmington, DE)
- Bio-Analyzer (Agilent Technologies, Santa Clara, CA)
- Thermocycler, Roche 480 instrument (Roche Applied Science, Indianapolis, IN)
Surgery/Necropsy
- Gas anesthesia system using methoxyflurane
- Anesthesia: Nembutal, 100 mg/kg body weight i.p., (Abott Laboratories)
- Gentamicin
- CO2 gas
High-Fat Liquid Diet
Composition Dextrose1 Protein2 Lipid3 (65.5 mL) Vitamin mixture4 Citric acid Salt solutions5 Tween-80 (5.0 mL) 100.0
- Calories are adjusted when EtOH is added, such that both high-fat only diet and high-fat with EtOH are equivalent in calories.
- Lactalbumin hydrolysate (extra soluble) peptone 60 dri-form (No. 1401800, Gibco, Santa Clara, CA).
- Mazola brand pure corn oil (Best Foods, Englewood Cliffs, NJ).
- Vitamin fortification mix (No. 104654, ICN Nutritional Biochemical, Corp, Irvine, CA).
- Mixture of stock salt solutions see reference for details.
Sample processing
- Liquid nitrogen
- Thermo Scientific Infinity ALT Liquid stable reagent (Thermo Electron, Melbourne, Australia)
- Ethylenediaminetetraacetic acid (EDTA, 5 mM) with 0.1 M borax (pH 9.3)
- L-Type TG-M Assay Kit (Wako Diagnostic, Richmond, VA)
- Isopropyl alcohol
- Alcohol concentration reaction buffer (Sigma-Aldrich reagents)
- 75 mL distilled water
- 40 mg NAD+ (#N7004)
- 15 mg Alcohol dehydrogenase (A7011-150KU)
- 2.82 glycine (#50046)
- 0.9 mL hydrazine hydrate (#18412)
Histopathology
- 10% neutral phosphate buffered formalin
- Hematoxylin and Eosin stain (H&E)
Extractions
- Chloroform
- Borohydride solution
- Sodium hydroxide (NaOH)
- n-amyl alcohol
HPLC reagents
- Standards: L-Cysteine, L-cystine, L-cystathionine, D,L-homocysteine, L-homocystine, L-methionine, glutathione (oxidized and reduced forms), cysteinylglycine, and sodium borohydride (Sigma Chemical Co. , St. Louis, MO).
- Sodium phosphate monobasic, monohydride (EM Science, Gibbstown, NJ).
- HPLC grade meta-phosphoric acid, acetonitrile, and 1-octanesulfonic acid (OSA) (Fluka, Milwaukee, WI).
- Deionized HPLC-grade water is prepared by passage through a
- 7-Fluorobenzofurazan-4-sulfonic acid (SBD-F) ammonium salt
- Tri-n-butylphosphine (TBP) in acetonitrile
- Glutathione, GSH (Sigma)
Protein detection
Molecular assays
- Protein Detection ELISA kit (KPL, Inc., Gaithersburg, MD)
- Primary antibodies against actin, BHMT, DDIT3 (CHOP), HSPA5 (GRP78), and SREBF1 (NSREBP1), Santa Cruz Biotechnology (Santa Cruz, CA)
- Secondary antibodies: IRDye680- and IRDye800-conjugate, LiCor (Lincoln, NE)
- Reverse transcriptase
- RNeasy Mini kit (Qiagen, Valencia, CA)
- Random primers and high capacity cDNA archive kit (Applied Biosystems, Foster City, CA)
- TaqMan® Probe-Based Gene Expression Analysis, (Applied Biosystems, Foster City, CA)
I. Gastric cannulation
a. Mice are fasted for 24h and then anesthetized for surgery by inhalation of methoxyflurane.
b. While adhering to aseptic surgical techniques, a 45-cm PE-90 polyethylene tube with a small silicon tip (1.5 mm) on one end is used for gastric cannulation.
c. Once fully anesthetized, a vertical midline incision is made in the skin of the abdomen from the xiphoid cartilage extending to the midabdomen near the umbilicus.
d. A second small incision is made in the dorsal cervical region between the scapular bones.
e. A subcutaneous tunnel is exposed, and 7-0 polypropylene sutures are passed 1-mm apart through the serosa and muscular layer of the stomach.
f. After a small opening is made in the forestomach between sutures, the proximal tip of the cannula is inserted 0.8 cm into the stomach.
g. The tube is anchored to the stomach wall with Dacron® suture and the stomach is replaced back into the abdominal cavity.
h. The small incision where the cannula exited through the abdominal wall is closed with 5-0 silk and tied around the cannula, resulting in tight fixation of the cannula to the abdominal wall.
i. The abdominal wall and skin are closed and sutured with 5-0 silk suture.
j. Mice are placed in a prone position and an anchoring button is sutured to the muscles of the dorsal cervix, and the skin is closed around the button stem with 5-0 silk suture. The estimated duration for the total surgical procedure is ~30 min.
k. To prevent postsurgical infection, gentamicin (8 mg/kg) is administered intraperitoneally.
l. The distal end of the cannula is allowed to exit through a flanged button.
m. A protective spring coil encapsulating the cannula is connected to a swivel, and then anchored with a button, allowing the mice to be able to move freely.
n. Intubated mice are placed in metabolic cages (singly housed) and the distal end of the gastric cannula is connected to another swivel and infusion pump (Fig. 1).
0. Mice are allowed to recover 1 wk with ad libitum access to food and water.
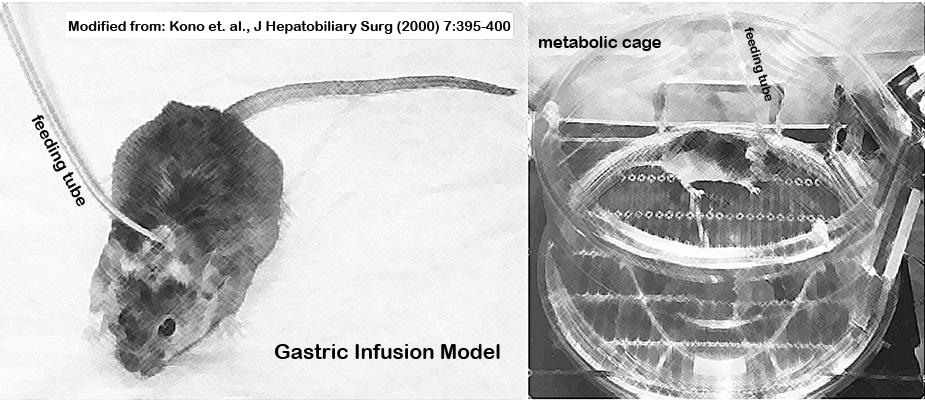
Figure 1. Gastric infusion model with mouse fitted with a feeding tube and kept in a metabolic chamber.II. Feeding liquid high-fat diet with or without EtOH, and urine collection
a. Mice are grouped into two cohorts: (1) control group, high-fat diet (HFD) and (2) treatment group, high-fat diet containing EtOH (HFD_EtOH) continuously for up to 4 weeks via intragastric feeding. The two cohorts are given an equivalent amount of daily calories.
b. Liquid HFD (1.29 to 1.31 kcal/mL), supplemented with isocaloric maltose-dextrin and lipotropes, is infused at a rate of 0.44 mL/g body weight per day with a peristaltic pump.
c. Liquid HFD_EtOH is delivered initially at 17.3 g/kg/day and is gradually increased 1.3 g/kg every 2 days until day 8, and then to 1.2 g/kg every 4 days until the dose reaches 27 g/kg/day (EtOH=40% of total calories). The amount of EtOH in the diet is varied from 4.0% to 8.0% to obtain optimal delivery of calories without compromising growth or survival. In addition to the liquid diet, the mice are given free access to water.
d. Urine samples are collected daily from the metabolic cage collection cups and stored at -80°C until analysis.
III. Euthanasia, blood collection via vena cava and liver dissection and fixation
a. Before mice are euthanized, final body weight is obtained.
b. The mice are euthanized by fully trained personnel using CO2 gas asphyxiation.
c. Terminal blood samples are collected via the vena cava for plasma and serum preparation (see below).
d. Livers are excised and weighed.
e. A slice of the medial lobe (Fig. 2) is fixed in 10% neutral buffered formalin for 48h for histopathologic examination. The remaining liver is snap-frozen in liquid nitrogen and stored at -80°C for protein extraction and RNA isolation.
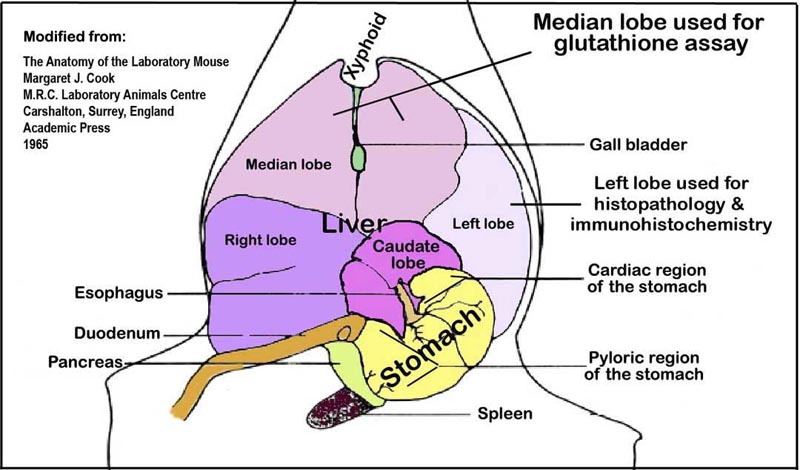
Figure 2. Liver lobes and their orientation within the abdominal cavity viewed ventro-dorsally.
IV. Blood chemistry: Plasma homocysteine
a. An aliquot (~ 450 µL) of terminal blood is collected into EDTA-containing tubes and immediately centrifuged at 1,500 rpm for 15 min at 4°C.
b. Aliquots of the plasma layer are transferred into cryostat tubes and stored at -20°C until analysis.
c. To determine the free (non-protein bound) aminothiol levels, an equal volume (100 µL) of freshly prepared 10% meta-phosphoric acid is added directly to 100 µL plasma followed by a 30-min incubation on ice.
d. After centrifugation for 15 min at 14,000 rpm at 4°C, the supernatant is likewise filtered before injecting 20 µL of the sample into the HPLC (see below).V. Blood chemistry: Serum amino transaminase (ALT)
a. Blood samples are allowed to clot at room temperature for at least 30 min.
b. Serum is separated from blood cells using a table top centrifuge at a speed of 14,000 rpm for 5 min.
c. The serum layer is pipetted carefully without disturbing the packed blood cell layer below and then transferred into a new pre-labeled tube and stored at -20°C until ready to be assayed.
d. An aliquot of frozen serum is completely thawed before testing for serum ALT levels using a spectrophotometer with the ALT Liquid stable reagent according to manufacturer's instruction.VI. Blood alcholol concentration (BAC) and urine alcohol concentration (UAC)
EtOH levels are determined by measuring absorbencies at 340 nm resulting from the reduction of NAD1 to the reduced form of nicotinamide adenine dinucleotide by alcohol dehydrogenase.
a. Aliquots of frozen serum and urine samples are allowed to thaw at room temperature.
b. Serum and urine samples are first diluted: 50 µL of serum or urine is added to 950 µL of water. Volume can be adjusted, but the dilution factor is kept the same.
c. Alcohol standards are prepared by adding 1.27 mL of absolute EtOH and bringing it to 100 mL volume using a volumetric flask kept at room temperature to make a 1000 mg/dL standard. This is diluted serially to get 500, 150, 125 and 0 mg/dL standards. Each standard is diluted the same way as the samples (20X).
d. Reaction buffer is prepared fresh and may be stored with a cover and refrigerated for up to 48h.
e. In duplicate, 20 µL of sample or standards is pipetted into 96-well plates, 200 µL of reaction buffer is added and mixed well.
f. Plate is covered and incubated at room temperature for 1.5 h before spectrophotometer absorbance is read at 340 nm.
g. Standard curves are plotted and unknown values for blood alcohol concentration (BAC) or urine alcohol concentration (UAC) are determined.
VII. Histopathology scoring liver injury
a. Formalin-fixed liver slices are further processed and embedded in Tissue Prep II paraffin, sectioned at 4 microns thickness, and mounted on glass slides.
b. Sections are stained with hematoxylin and eosin (H&E) and coverslipped.
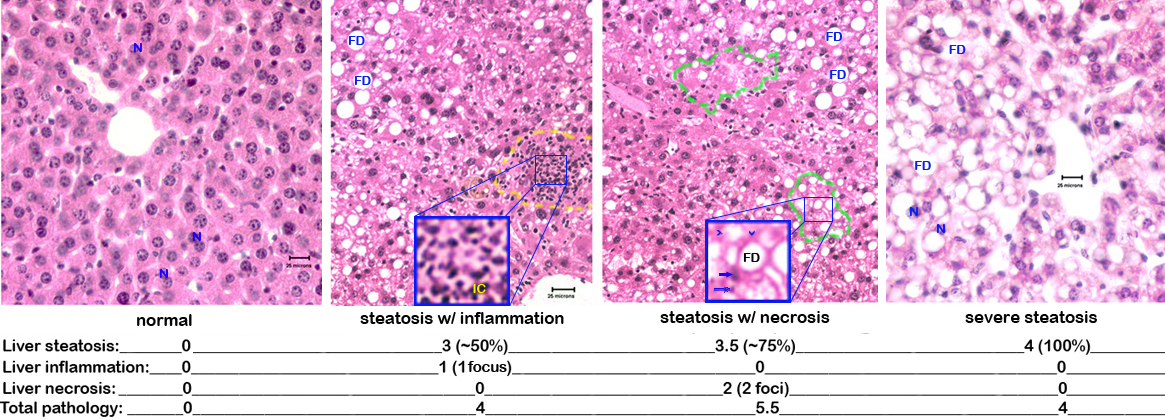
c. Each slide is scored blindly by a certified veterinary pathologist for liver injury as follows: steatosis (the percentage of hepatocytes containing fat): 0-25% = 0.5-1.5, 25-50% = 2-2.25, 50-75% = 3-3.5, 75-100% = 4 ; inflammation and necrosis: 1 focus per low-power field = 0-1.5, 2 or more foci = 2 (Fig. 3).
Figure 3. Photomicrograph examples of liver pathology. N= nucleus (note binucleated hepatocytes in the normal liver), FD= fat droplet, IC= inflammatory cells, arrow heads= "ghost cells" missing their nuclei, arrows= pycnotic nuclei.VIII. Liver protein and lipid extraction
a. A 50-mg sample of frozen liver from each mouse is homogenized in borax/EDTA (pH 9.3).
b. The homogenized liver is then mixed thoroughly with chloroform by vortexing and then centrifuging at 1,500 rpm for 15 minutes at -4°C to separate unwanted precipitates.
c. For additional purification, liver samples are placed at -20°C for at least 2h followed by centrifugation at 12,000 rpm at 4°C for 10 min.
d. Aliquots of the supernatant are pipetted in duplicate tubes per liver sample and labeled, one for reduced glutathione and the other for total glutathione, and stored at -20°C until analysis.
e. For determination of total aminothiols, the disulfide bonds are reduced and protein-bound thiols are released by the addition of 50 µL freshly prepared 1.43 M sodium borohydride solution containing 1.5 µM EDTA, 66 mM NaOH, and 10 µL n-amyl alcohol to each aliquot of liver sample.
f. After gentle mixing, the solution is incubated in 40°C water bath for 30 min with gentle shaking.
g. To precipitate and remove further remove unwanted liver proteins, 250 µL ice-cold 10% meta-phosphoric acid is added and the sample is incubated for 10 min on ice.
h. After centrifugation at 14,000 rpm for 15 min at 4°C, the supernatant is filtered through 0.2 µ filter and a 20 µL sample is injected into the HPLC system described below.
i. For the determination of free (non-protein bound) aminothiol levels, an equal volume of freshly prepared 10% meta-phosphoric acid is added directly to 200 µL aliquoted liver sample followed by a 30-min incubation on ice.
j. After centrifugation for 15 min at 14,000 rpm at 4°C, the supernatant is filtered as above before injecting 20 µL of the sample into the HPLC system.
k. For the determination of hepatic triglycerides, 20 mg of frozen liver tissue is homogenized in 500 µL of isopropyl alcohol, and 4 µL of the extract is used in subsequent analysis.
IX. Analysis of liver tissue extracts and plasma
Plasma and liver aminothiols are separated by HPLC coupled with a Shimadzu solvent delivery system (model 580). A reverse phase C18 NBS column is used with a mobile phase consisting of 50 mM sodium phosphate monobasic, monohydrate, 1.0 mM ion-pairing reagent 1-octanesulfonic acid, 2% acetonitrile (v/v), adjusted to pH 2.7 with 85% phosphoric acid.
a. Plasma and liver extracts are directly injected onto the column using an autosampler.
b. Isocratic elution is performed at ambient temperature at a flow rate of 1.0 mL/min and a pressure of 120 to 140 kgf/cm2 (1,800 â 2,100 psi; or 11.7 - 13.7 kPa).
c. To assure standardization between sample runs, calibration standards are interspersed at intervals and duplicate reference liver standards are included. Also, before sample analysis, standard curves are examined each day using frozen aliquots of stock calibration solution. The limit of detection for standard calibration standards is defined as the concentration that produced a signal-to-noise ratio greater than 5.
d. Linear calibration curves consisting of 4 to 5 points for each compound are generated in the following biologic ranges for each compound: 0.5 to 100 nmol/mL homocysteine, 5 to 350 nmol/mL cysteine, 5 to 200 nmol/mL cysteinylglycine, 0.5 to 100 nmol/mL reduced glutathione, and 0.5 to 500 nmol/mL oxidized glutathione.
e. Reduced liver glutathione (GSH), oxidized liver glutathione (GSSG), plasma and liver homocysteine, liver S-adenosylhomocysteine (SAH), liver methionine, liver S-adenosylmethionine (SAM) protein concentrations are reported in nmol per mg of liver sample.
f. The level of hepatic triglycerides is determined by using L-Type TG-M Assay Kit according to the manufacturerâs instructions, and the concentration is reported in mg / g of liver sample.X. Western Blot
Proteins are extracted from the liver and analyzed by immunoblotting using horseradish peroxidase-labeled or alkaline phosphatase-labeled secondary antibodies.
a. Liver tissues are collected from three representative mice per group (based on liver pathology phenotypes).
b. Antibodies against actin, heat shock protein 5 (HSPA5 formerly GRP78), DNA-damage inducible transcript 3 (DDIT3 formerly CHOP), betaine-homocysteine methyltransferase (BHMT), and sterol regulatory element binding transcription factor 1 (SREBF1 formerly NSREBP1) are used as primary, while IRDye680- and IRDye800-conjugated antibodies are used as secondary.
c. Blots are scanned using the Odyssey system and intensity of the bands is quantified with ImageJ.
d. The intensity of protein bands on the blots is normalized to actin and to corresponding strainâs high-fat diet (HFD) samples.
e. Relative protein expression of BHMT, DDIT3 (CHOP), HSPA5 (GRP78), and SREBF1 (NSREBP1) are expressed as percent of control HFD mice.
XI. RNA isolation and gene expression analysis
a. Total RNA is extracted from liver using the RNeasy Mini kit according to manufacturer's instructions.
b. RNA concentrations are measured with NanoDrop ND-1000 spectrophotometer.
c. RNA quality is verified using the Bio-Analyzer.
d. Total RNA (2 μg) is reverse transcribed using random primers and the high capacity cDNA archive kit according manufacturer's instructions.
e. The following primers are used for quantitative real-time Polymerase-Chain Reaction (qPCR) according to Applied Biosystems protocol:
Gene Probe ID Gene Probe ID Acox1 Mm01246831_m1 Gnmt Mm00494688_m1 Adipor2 Mm01184032_m1 Gusb Mm01197698_m1 Ahcy Mm01742465_sH Mat1a Mm00522563_m1 Cbs Mm00460654_m1 Mthfr Mm00487784_m1 Cebpa Mm00514283_s1 Mtr Mm01340053_m1 Cth Mm00461247_m1 Mttp Mm00435015_m1 Ddit3 (Chop) Mm00492097_m1 Srebf1 Mm00550338_m1 f. Reactions are performed in a 96-well assay format using the Roche 480 Thermocycler.
g. Each plate, containing one set of experimental genes and a housekeeping gene (Gusb), are plated in duplicate.
h. The cycle threshold (Ct) for each sample is determined from the linear region of the amplification plot.
i. The ÎCt are calculated using values for HFD_EtOH mice relative to strain-matched control HFD means.
j. The ÎÎCt values for all genes relative to the control housekeeping gene Gusb are determined.
k. Relative mRNA abundance is expressed as percent of control HFD mice.
alanine aminotransferase enzyme is a biological marker for hepatocyte degeneration or liver injury hematoxylin and eosin blood alcohol concentration nicotinamide adenine dinucleotide cycle threshold; defined as the fractional PCR cycle number at which the reporter fluorescence is greater than the threshold pounds force per square inch delta Ct; value change in cycle threshold as a function of target molecule change in abundance TG triglycerides delta-delta Ct; comparative Ct, a method for relative quantification of target molecule (see equation below) SAH S-adenosylhomocysteine (reduced) glutathione, the predominant form in the liver SAM S-adenosylmethionine glutathione in oxidized state UAC urine alcohol concentration Inflammation: change in liver morphology histologically observed as inflammatory cell infiltrates surrounding intact or degenerating hepatocytes.
Inflammation score: 1 focus per low-power field = 1-1.5; 2 or more foci = 2-2.5.
Necrosis: change in liver morphology histologically observed as hepatocytes undergoing irreversible degeneration manifested by nuclear changes and eventual disappearance and presence of "ghost" cells.
Necrosis score: 1 focus per low-power field = 1-1.5; 2 or more foci = 2-2.5.
Steatosis: change in liver morphology histologically observed as hepatocytes containing fat.
Steatosis score: the percentage of hepatocytes containing fat, 0-25% = 0.5-1.5; 25-50% = 2-2.5; 50-75% = 3-3.5; 75-100% = 4-4.5.
Total pathology = steatosis score (0-4.5) + inflammation score (0-2.5) + necrosis score (0-2.5)
Relative change in transcript abundance X = 2-ÎÎCT
where ÎÎCt = (Ct,target - Ct,reference)sample - (Ct,target - Ct,reference)normal
- target = target gene of interest
- reference = housekeeping gene
- sample = sample of interest (e.g., liver cells from mice fed with EtOH and/or HFD)
- reference = tissue from normal healthy specimens (e.g., livers from mice fed normal diet)
Data collected by investigator
- blood chemistry
- homocysteine concentration (plasma)
- blood alcohol concentration (BAC)
- urine alcohol
- urine alcohol concentration (UAC), daily average
- urine alcohol concentration (UAC), daily peak
- liver weight as a percent of body weight
- liver pathology
- liver steatosis (0-4) [score]
- liver inflammation (0-2) [score]
- liver necrosis (0-2) [score]
- total liver histopathology (0-8) [score]
- liver biochemistry
- hepatic triglycerides (TG)
- reduced liver glutathione (GSH)
- oxidized liver glutathione (GSSG)
- liver homocysteine
- liver S-adenosylhomocysteine (SAH)
- liver methionine
- liver S-adenosylmethionine (SAM)
- Western blot
- BHMT
- DDIT3 (CHOP)
- HSPA5 (GRP78)
- SREBF1 (NSREBP1)
- Gene expression
- Acox1
- Adipor2
- Ahcy
- Cbs
- Cebpa
- Cth
- Ddit3 (Chop)
- Gnmt
- Mat1a
- Mthfr
- Mtr
- Mttp
- Srebf1
References
|
Bergmeyer HU, ed. Methods of enzymatic analysis. (book) Academic Press, 1988.
Bradford BU, O'Connell TM, Han J, Kosyk O, Shymonyak S, Ross PK, Winnike J, Kono H, Rusyn I. Metabolomic profiling of a modified alcohol liquid diet model for liver injury in the mouse uncovers new markers of disease. Toxicol Appl Pharmacol. 2008 Oct 15;232(2):236-43. Epub 2008 Jul 12.
Bradford BU, Rusyn I. Swift increase in alcohol metabolism (SIAM): understanding the phenomenon of hypermetabolism in liver. Alcohol. 2005 Jan;35(1):13-7.
Kono H, Bradford BU, Rusyn I, Fujii H, Matsumoto Y, Yin M, Thurman RG. Development of an intragastric enteral model in the mouse: studies of alcohol-induced liver disease using knockout technology. J Hepatobiliary Pancreat Surg. 2000;7(4):395-400.
Kono H, Uesugi T, Froh M, Rusyn I, Bradford BU, Thurman RG. ICAM-1 is involved in the mechanism of alcohol-induced liver injury: studies with knockout mice. Am J Physiol Gastrointest Liver Physiol. 2001 Jun;280(6):G1289-95.
Melnyk S, Pogribna M, Pogribny I, Hine RJ, James SJ. A new HPLC method for the simultaneous determination of oxidized and reduced plasma aminothiols using coulometric electrochemical detection. J Nutr Biochem. 1999 Aug;10(8):490-7.
Melnyk S, Pogribna M, Pogribny IP, Yi P, James SJ. Measurement of plasma and intracellular S-adenosylmethionine and S-adenosylhomocysteine utilizing coulometric electrochemical detection: alterations with plasma homocysteine and pyridoxal 5'-phosphate concentrations. Clin Chem. 2000 Feb;46(2):265-72.
Nanji AA, Mendenhall CL, French SW. Beef fat prevents alcoholic liver disease in the rat. Alcohol Clin Exp Res 1989;13:15-9.
Pogribny IP, Tryndyak VP, Bagnyukova TV, Melnyk S, Montgomery B, Ross SA, Latendresse JR, Rusyn I, Beland FA. Hepatic epigenetic phenotype predetermines individual susceptibility to hepatic steatosis in mice fed a lipogenic methyl-deficient diet. J Hepatol. 2009 Jul;51(1):176-86. Epub 2009 May 3.
Trasler J, Deng L, Melnyk S, Pogribny I, Hiou-Tim F, Sibani S, Oakes C, Li E, James SJ, Rozen R. Impact of Dnmt1 deficiency, with and without low folate diets, on tumor numbers and DNA methylation in Min mice. Carcinogenesis 2003;24:39-45.
Wheeler MD, Kono H, Yin M, Nakagami M, Uesugi T, Arteel GE, Gäbele E, Rusyn I, Yamashina S, Froh M, Adachi Y, Iimuro Y, Bradford BU, Smutney OM, Connor HD, Mason RP, Goyert SM, Peters JM, Gonzalez FJ, Samulski RJ, Thurman RG. The role of Kupffer cell oxidant production in early ethanol-induced liver disease. Free Radic Biol Med. 2001 Dec 15;31(12):1544-9.
|