Lake1 project protocol
Multi-system analysis of mouse physiology, C57BL/6J-Chr#A/J/NaJ chromosome substitution panel (2005)
Lake J, Donahue L, Davisson MTProject protocol — Contents
Workflow and samplingProcedure: Complete blood count (CBC) with differential using the Bayer ADVIA 120 Hematology Analyzer
Equipment_CBC
Reagents, supplies, and solutions
Data
ReferencesProcedure: Blood chemistry and electrolyte measurement using Beckman CX5 Synchron Delta Chemistry Autoanalyzer
Equipment_Chemistry
Reagents, supplies, and solutions
DataProcedure: Lung function evaluation using BUXCO whole body plethysmograph (WBP)
Equipment
Reagents, supplies, and solutions
Data
ReferencesProcedure: Blood pressure and pulse analysis using the Visitech BP-2000 system
Equipment
Reagents, supplies, and solutions
Data
ReferencesProcedure: Electrocardiograms (ECG) in conscious mice using the AnonyMouse ECG screening system
Equipment
Reagents, supplies, and solutions
Data
ReferencesWorkflow
Hematology Complete differential cell count Blood plasma chemistry Total Cholesterol (CHOL), High Density Lipoprotein (HDL), Free Fatty Acids (FFA), Triglycerides (TG), Glucose (GLU), Aspartate Aminotransferase (AST), Total Bilirubin (Bilirubin) Lung function Breath frequency response, tidal volume response, Penh response Blood pressure and pulse Pulse, systolic blood pressure Electrocardiogram (ECG) ECG waveform intervals, heart rate Acclimation to test conditions
In general all mice are brought into the procedure room and are tested within 1hr.
_____________________________
Hematology
Purpose: To generate hematological phenotypic profile for C57BL/6J-Chr#A/NaJ consomic strains using the ADVIA 120 system.
- ADVIA® 120 Hematology System (Bayer Diagnostic Division (Siemens), Tarrytown, NY, USA)
- 1.5 mL Eppendorf tubes
- Microhematocrit tubes, EDTA coated
- Toothpicks
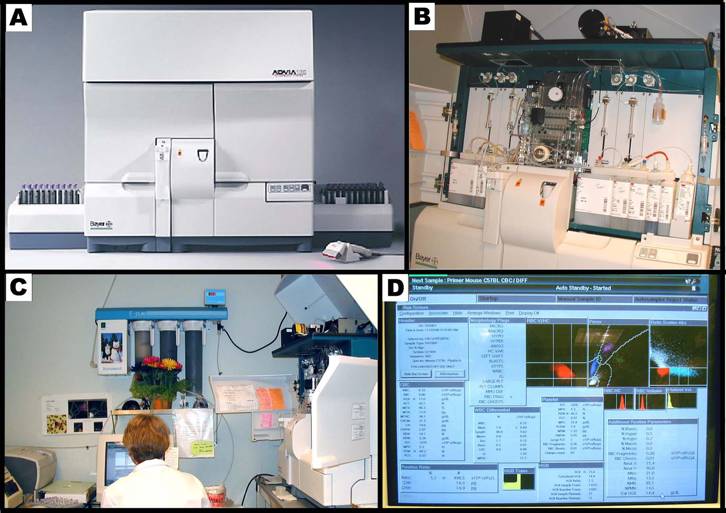
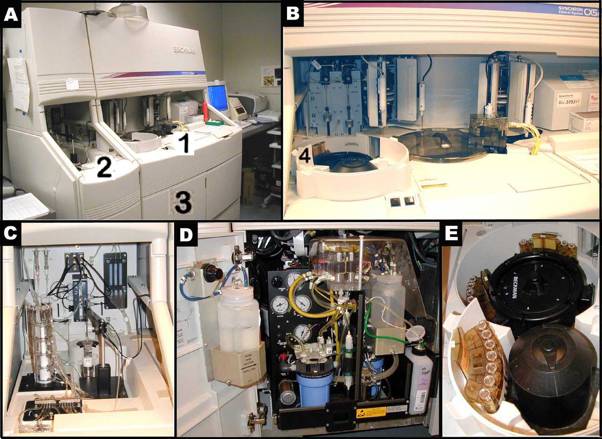
Panel A shows the Bayer ADVIA 120 hematology analyzer system. Panel B shows the internal layout of the ADVIA, and the various reagents used in the system. Panel C shows the hematology setup, equipped with a computer and a printer. Panel D shows a typical computer screen-output.
- ADVIA® 120 Hematology System
- ADVIA TESTpoint Hematology Controls
- ADVIA 120 autoRETIC Reagent T01-3622-01
- Perox Sheath T01-3633-01
- Perox 1 T01-3630-01
- Perox 2 T01-3631-01
- Perox 3 T01-3632-01
- RBC/PLT T01-3627-01
- HGB T01-3628-01
- BASO T01-3629-01
- AutoRETIC T01-3622-01
- EZ KLEEN T01-3624-01
- Defoamer T01-3625-04
- Sheath/Rinse T01-3664-01
- 20% EDTA, Tetrasodium Salt (Fisher Lab item number BP121-500), anticoagulant
Procedure: Complete blood count (CBC) with differential using the Bayer ADVIA 120 Hematology Analyzer
I. Blood collection
a. Blood is collected from non-fasted mice.
b. Collection tubes (1.5 mL Eppendorf) are pre-loaded with 20µL of 20% EDTA.
c. A clean retro-orbital bleed is performed using EDTA-coated microhematocrit tubes.
d. Blood collection tubes are filled to a final volume of 250µL and then kept at room temperature for the duration of the test.
e. The blood sample is checked for clots using a toothpick. (In the presence of a clot, the sample is discarded to avoid "aspiration failure" and lost data during sample run.)II. Using Bayer ADVIA 120 system to conduct CBC with differential and reticulocytes count
a. Blood samples are gently mixed well (by rolling the vial the between hands) and kept at ambient temperature.
b. Samples are run according to manufacturer's instructions.
c. As part of ADVIA daily routine maintenance, a control run is initially performed. This usually takes about 25 min to do. Since controls contain human blood cells in a preservative medium, proper safety precaution is exercised with the use of disposable gloves.
d. As long as calibrated commercial controls are within established ranges, the PRIMER sample can be run first (to get the system "wet") in preparation for the test samples. Each run takes about 1 min, when done through open tube aspiration wand.
e. To prevent "aspiration failure" or loosing a sample run, the blood sample is double-checked for clots so that no air gap is introduced while the sample is being aspirated.
f. After each successful run, a lab screen pops up that can be hidden to return to Manual Sample ID Screen, and to review the result via the quality control (QC) button.
g. After a hard copy of a successful run is automatically printed, the next sample is ready to be run.
h. Values reported are those obtained directly from the ADVIA.
i. No correction for the small dilution is made.Data collected by investigator
- total white blood cell count (WBC)
- total red blood cell count (RBC)
- measured hemoglobin concentration (HGB)
- calculated hemoglobin (HGB)
- hematocrit (HCT)
- mean corpuscular volume (MCV)
- mean corpuscular hemoglobin (MCH)
- mean corpuscular hemoglobin concentration (MCHC)
- platelet count (PLT)
- mean platelet volume (MPV)
- reticulocytes count (Retic)
- RBC corpuscular distribution width (RDW)
- RBC corpuscular hemoglobin concentration mean (CHCM)
- RBC hemoglobin concentration distribution width (HDW)
- neutrophil count (NEUT)
- lymphocyte count (LYMPH)
- monocyte count (MONO)
- eosinophil count (EOS)
- basophil count (BASO)
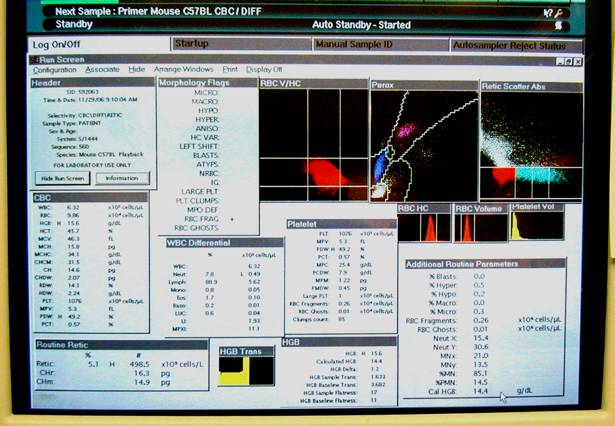
This figure illustrates a close-up display of the computer screen result in Panel D above.Definitions & formulas
WBC differential percentages were computed for each cell type as follows:
% NEUT = [(NEUT count x 106) ÷ (total WBC count x 106)] x 100
% LYMPH = [(LYMPH count x 106) ÷ (total WBC count x 106)] x 100
% MONO = [(MONO count x 106) ÷ (total WBC count x 106)] x 100
% EOS = [(EOS count x 106) ÷ (total WBC count x 106)] x 100
% BASO = [(BASO count x 106) ÷ (total WBC count x 106)] x 100
HCT (hematocrit) = (RBC X MCV)÷10 representing the PCV (packed cell volume)
% Retic = [(Retic count x 109) ÷ (total RBC count x 109)] x 100
Peters LL, Cheever EM, Ellis HR, Magnani PA, Svenson KL, Von Smith R, Bogue MA. Large-scale, high-throughput screening for coagulation and hematologic phenotypes in mice. Physiol Genomics. 2002 Dec 3;11(3):185-93. Pubmed: 12419856
______________________________
Blood Plasma Chemistry
Purpose: To generate blood plasma chemistry profiles for C57BL/6J-Chr#A/NaJ consomic strains using the Beckman Coulter Synchron CX5.
Workflow and sampling
Workflow
Procedure accomplished Mice are fasted: food and water removed for 4h Sample tubes prepared for blood collection Blood collected via retro-orbital vein Post-blood collection clean-up Blood samples centrifuged at 4°C Plasma extracted (frozen when stored) Beckman CX5 system calibrated Reagents changed or replenished System controls run Plasma HDL test prepared Plasma HDL measured automatically Plasma CHOL, GLU and TG prepared Plasma CHOL, GLUC and TG measured automatically Final clean-up Computer printed data are labeled, data files collected and stored on disks
- Micro-hematocrit tubes (75 µL capacity) coated with Heparin and equipped with a rubber bulb expunger
- Refrigerated tabletop micro-centrifuge: Eppendorf Centrifuge, Model # 5415C.
- Repeat pipettors and regular Pipetman: 250 µL and 100 µL, respectively.
- Automated blood chemistry analyzer: Synchron CX5 Delta (Beckman Coulter, Inc., Fullerton, CA).
- A dedicated DOS-based desktop computer controls the programming of this analyzer.
- A dedicated printer prints the results as they are measured, and an electronic file is simultaneously transferred to a second, Windows-based computer, which stores the data files.
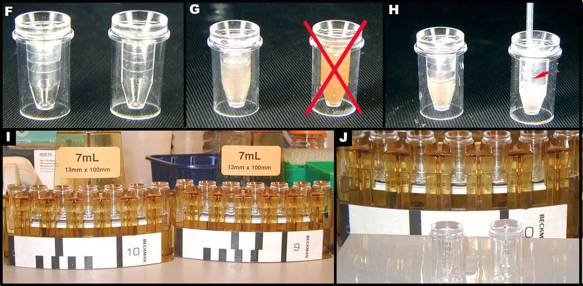
Panels A-E illustrate the Beckman Synchron CX5 Delta. Panel B shows a closer look of area 1 in Figure A. Figure C presents a closer look of area 2 in Panel A. Panel D depicts a closer view of area 3, where ancillary reagents are refilled in Panel A. Panel E reveals the content of area 4, where samples are set up in trays for an automated run in Panel B.Expendables:
(1) 1.5 µL Eppendorf tube
(2) 0.5 mL Beckman Coulter Microtube Tubecup ("sector cup")
(3) 100 µL and 250 µL pipette tipsFor Synchron CX5 parts and all consumables: Beckman Customer Support
- Heparin anticoagulant (Sigma (Sodium Salt) 50,000 U Cat. #H-3393)
- Heparin 1000 U/mL
- 50mL of distilled autoclaved/sterile water + 50,000U Heparin Stock Solution
- Polyethylene glycol (PEG) (Sigma, Cat. #P7181)
Notes on reagents: The Chemistry Analyzer (or "CX5") uses Beckman Coulter three-compartment reagent cartridges for HDL, CHOL, TG, and GLU. Each cartridge contains enough reagents for 300 tests (approximately 104 mL). In addition, in order to run the HDL Cholesterol test, HDL Cholesterol Separation Reagent (15 µL per sample) is needed. The bottle from Beckman Coulter contains a volume of 34 mL. If the dilution of plasma samples becomes necessary due to low plasma volume, use 0.9% saline solution for the dilution.
Reagent: Reorder Number:
Cholesterol (CHOL) Reagent 467825
Glucose (GLU) Reagent 442640
Triglycerides (TG) Reagent 445850
- Calibration Reagents: The two calibration reagents are "Synchron Systems HDL Cholesterol Calibrator" (for HDL only), and "Synchron Systems Multi Calibrator" (for CHOL, GLU, and TG).
- Controls: The controls for HDLc are Beckman Coulter Vigil Lipid Control 1 and Beckman Coulter Vigil Lipid Control 2. The controls for CHOL, GLU and TG are Synchron Control Comprehensive Chemistry Control Serum Level 1, Level 2 and Level 3.
Procedure: Blood plasma chemistry and electrolyte measurement using Beckman CX5 Synchron Delta Chemistry Autoanalyzer
I. Blood plasma collection
a. Only previously fasted (4h) mice are used for the collection of blood.
b. Approximately 225 µL of blood (8-9 drops, depending on the size of the mouse) are obtained via retro-orbital bleed using heparin-coated Hematocrit tubes. Remaining blood in the Hematocrit tube is flushed out using a rubber squeeze bulb assembly.
c. Blood is collected into pre-labeled 1.5 mL Eppendorf tubes pre-loaded with 7.5 µL of the anticoagulant Heparin 1000U/mL, gently finger flicked and mixed or stirred, and momentarily stored in ice until all the samples are ready to be centrifuged.
d. Blood samples are then centrifuged for 5 min at 14,000 RPM using a refrigerated table-top micro-centrifuge to separate the plasma.
e. The top plasma layer is pipetted (~100µL) into pre-labeled 0.5 mL Eppendorf tubes and frozen until ready to be assayed; remaining packed blood cell layer is discarded.
f. Previously frozen samples are defrosted at room temperature for about 30 min before measurements are done.NOTES: Air bubbles are avoided and eliminated during sample loading in sector cups as they interfere with the colorimetric assay.
II. Using Beckman CX5 Synchron system to measure plasma glucose and lipids chemistries
Panel F shows 2 empty sector cups. Panels G shows sector cups with/out hemolyzed sample, and Panel H shows sector cups without and with (red arrow) air bubbles. Panels I and J show consecutive sector trays identified with bar codes and seven sector cups contained within each tray.a. In preparation for the auto-analyzer, bar-coded sectors with cups in place are loaded with 85 µL of completely thawed plasma (enough for the direct measurement of CHOL, GLU, and TG).
b. Up to five sectors are manually placed on the carousel to be run. Since each sector is bar-coded, the Beckman automatically detects a sector that has been run; regardless, finished sectors are removed immediately as soon as they come up.
c. The Beckman CX5 is operated according to manufacturer's instructions in the measurement of plasma HDL, CHOL, GLU, and TG, which are run together.
d. -Function key F1 is used to deploy "Sample Program", Sample type "2" is for plasma• Function key F2 is used to deploy "Program Batch/Sector(s)" and "sector(s) to program:" (i.e. sectors 1-5 is programmed). When "Batch mode activated, 7 cups possible. "Number of cups in batch:" message is displayed, the total cups for this batch is then (7 x 5) = 35 cups (the maximum number of cups that can be ran in a batch is 98). To program remaining sectors, F2 Program Batch is deployed again.
• Panel "12" is preprogrammed for CHOL/GLU/TG and "HDLD" is manually "Selected" from the screen menu. Once the correct chemistries are selected, they are "ENTERed" to bring about "SAMPLE TYPE", wherein "2" is given to denote plasma (not serum).
• Function key F8 is used to set up the programmed batches and to advance to the next cup/sample (from cup #1 up to cup #7) in a given sector. By selecting F8 ID numbers can be recorded and reviewed against an Excel reference sheet.
Note: Since ID sample numbers or field identifiers are un-editable once Beckman CX5 is in operation, relevant information, including sample type (i.e. plasma vs serum), dilution factor, and other information must be precisely entered.
• As soon as six sectors are programmed, the <prev screen> is activated first, and then the Master Screen, and then last START (green) button. The Beckman automatically starts sampling the first five programmed sectors. Additional sectors can be programmed while the Beckman is operating.
• In the event that the Beckman alarm is activated because of reagent volume getting low, <prev screen> is activated to turn off the alarm and make the necessary notations for the record. The next available reagent cartridge is automatically installed.
• When all the data is safely recorded, Function key F5 is used to clear all the information regarding a sector after ENTERing the number of the sector to be deleted.
• Once a sector is finished running, the results are automatically printed, removed from the printer, and then labeled accordingly. Otherwise, the printed paper is checked and guarded from rolling back into the printer and disrupting the data recording.
• Used Eppendorf tubes, pipette tips, sector cups, and reagent cartridges are discarded into biohazard waste containers, and any spilled liquids are cleaned.
Data collected by investigator
Blood plasma chemistry (4-hr fast)
- Total Bilirubin (TBIL)
- Total Cholesterol (CHOL)
- High Density Lipoprotein (HDL) in/direct measurement
- Triglycerides (TG)
- Aspartate Aminotransferase (AST)
- Total Fatty Acids (TFA)
- Glucose (GLU)
Definitions & formulas
The average of the diluent analyzer value is subtracted from the analyzer value multiplied by two (dilution factor) to obtain the HDL (indirect) values.
HDL (indirect) values = (sample analyzer value x 2) - average of diluent analyzer value
___________________________
Lung Function
Purpose: To obtain lung function profiles for C57BL/6J-Chr#A/NaJ consomic strains using the non-invasive whole body plethysmograph (WBP).
- Buxco 12 unit plethysmograph system (Buxco Electronics, Inc. Troy, NY)
- Each whole body plethysmograph (WBP) chamber is connected to a bias flow regulator to supply a smooth, constant flow of fresh air during testing. A transducer attached to each chamber detects pressure changes that occur as the animal breathes. Pressure signals are amplified by a MAX II Strain Gauge preamplifier and analyzed by the Biosystem XA software supplied with the system (BUXCO Electronics, Inc.). Pressure changes within each chamber are calibrated prior to testing by injecting exactly 1 mL of air through the injection port and adjusting the computer signal accordingly.
- Dryerite desiccant chips, replaced as needed when color indicator turns purple
- Silicon grease: for air-tight seals on plethysmograph o-rings
- Filter papers, 0.2 µm pore size
- White cloth disks: for drying columns
- Protective equipment (mask and gloves) is always worn when handling powdered methacholine. Used and contaminated gloves are inverted and disposed in biohazard bags.
Note: Methacholine is potentially hazardous if inhaled so proper precautions are implemented whenever the pure powder is used. In case of accidental exposure, a bronchial inhaler and an autoinjector of epinephrine (EpiPen) must be readily available.
Acclimation to test conditions
- Methacholine (5, 10, and 20 mg/mL) stock solutions
- Pure powdered methacholine is stored in the freezer, with desiccant.
- Prepared solutions of methacholine are stored for no more than 5 wks in the freezer at -20°C
- Stock solutions of methacholine are prepared only in a hood.
- To minimize repeated exposure, 200 mg ± 40 mg of methacholine is aliquoted in 30 or more tubes (10 mL Fisher tubes with caps) at a time under a hood.
- To make solution A (20 mg/mL): In an aliquot of 200mg Methacholine, 10mL of 0.9 % Sodium Chloride solution is added.
- To make solution B (10 mg/mL): Solution A is diluted 1:1 with 0.9% Sodium Chloride solution.
- To make solution C (5 mg/mL): Solution B is diluted 1:1 with 0.9% Sodium Chloride solution.
- 0.9 % NaCl normal/physiological saline; to make stock solution of normal saline:
- 900 mg Sodium Chloride (NaCl)
- 100 mL of distilled-deionized water
- Mixed in 100 mL volumetric flask and then autoclaved (sterilized)
- Cleaning solution: mild soap and water for cleaning the cells
- Gases:
- 4.0% Carbon Dioxide, 21% Oxygen, Balance Nitrogen
- 4.0% Carbon Dioxide, 10% Oxygen, Balance Nitrogen
- 8.0% Carbon Dioxide, 21% Oxygen, Balance Nitrogen
- Silicon grease: for air-tight seals on plethysmograph o-rings
Mice are allowed to acclimatize for 15-20 min after being placed in the test apparatus.
Procedure: Assessment of Pulmonary Function using Whole Body Plethysmograph (WBP)
Whole body plethysmograph (WBP) permits mice to move freely within the chambers while lung function is assessed. Twelve mice/chamber are tested simultaneously per session.
a. Before use the whole body plethysmograph system is calibrated according to manufacturer's recommendations.
b.Following standard calibration, mice are placed within the chambers of a Buxco full body plethysmograph, and then allowed to acclimate for 20 min.
c. During the acclimation period, the system is checked and fixed for any gas/air leaks within all twelve chambers.
d. When all systems are leak free, lung function tests are initiated in the presence of room air following manufacturer's instructions.
e. Testing is conducted by letting the animals move and breathe freely for 15 min while the following parameters are measured: Tidal Volume (TV), Respiratory Rate or Breath Frequency Response (RR), Peak Inspiratory Height (PIF), Peak Expiratory Height (PEF), Expiratory Time (Te), and Time to expire 65% of the lung "volume" (Rt).
f. Raw data for each of the parameters listed above are captured in the software database and averaged once per minute to give a total of 15 data points per parameter (except for Accumulated Volume—see below).
g. The average of the 15 data points is reported. Accumulated Volume (mL) is a cumulative value (not averaged) and represents the sum of all tidal volumes for the 15 min test session.
h. The protocol is customized to include measurements before, during, and after room air and saline controls as well as methacholine challenge at various concentrations (5, 10, and 20mg/kg) to determine.
i. After each measurement session, data are saved on a disk, and the chambers are thoroughly cleaned and prepared for the next batch of mice to be tested.Data collected by investigator
Definitions and calculations
- breath frequency response to MCh
- tidal volume response to MCh
- Penh response to MCh
Penh: PEF/PIF x Pause [Peak Expiratory Height ÷ Peak Inspiratory Height] x Pause
Pause: Te/Rt-1 [Expiratory time ÷ Time to expire 65% of the "volume"] – 1
Tankersley CG, Fitzgerald RS, Kleeberger SR. Differential control of ventilation among inbred strains of mice. Am. J. Physiol. 1994; 267:R1372-R1377. PubMed: 7977867
Hamelmann E, Schwarze J, Takeda K, Oshiba A, Larsen GL, Irvin CG, and Gelfand EW. Noninvasive measurement of airway responsiveness in allergic mice using barometric plethysmography. Am. J. Respir. Crit. Care Med. 1997; 156:766-775. PubMed: 9309991
Petak F, Habre W, Donati YR, Hantos A, Barazzone-Argiroffo C. Hyperoxia-induced changes in mouse lung mechanics: forced oscillations vs. barometric plethysmography. J. Appl. Physiol. 2001; 90:2221-2230. PubMed: 11356786
Albertine KH, Wang L, Watanabe S, Marathe GK, Zimmerman GA, and MChintyre TM. Temporal correlation of measurements of airway hyperresponsiveness in ovalbumin-sensitized mice. Am. J. Physiol. 2002; 283:L219-L233. PubMed: 12060580
Lundblad LKA, Irvin CG, Adler A, and Bates JHT. A reevaluation of the validity of unrestrained plethysmography in mice. J. Appl. Physiol. 2002; 93:1198-1207. PubMed: 12235015
__________________________
Blood Pressure and Pulse
Purpose: To generate blood pressure and pulse phenotypic profiles for C57BL/6J-Chr#A/NaJ consomic strains using the using the Visitech BP-2000 system.
Reagents and solutions
- Equipment and Instrumentation: Visitech BP-2000, Cary, NC.
- Thermometers: alcohol or mercury filled
- Bandage scissors
- Balloons (for tail cuffs)
- Medical tape
- Paper towels
- Ethanol (70%) and/or "baby wipes"
- Smooth tubing clamps
- Heat gun
Ethanol (70%) and/or "baby wipes"
Acclimation to test conditions
Mice are acclimated and trained to test conditions for 5 days prior to obtaining recorded measurements.
Procedure: Blood pressure and pulse analysis using the Visitech BP-2000 system
Measurements of systolic blood pressure and pulse rate are obtained from unanesthetized 10 wk-old mice with minimal restraint using the Visitech BP-2000 system. The Visitech BP-2000 system is a non-invasive blood pressure and pulse analyzer that can accommodate 4 mice simultaneously per session. In order to obtain consistency in the results, mice are first conditioned in the system the same time everyday for at least 5 days prior to an additional 5 days of recorded measurements.
Essential checklist
a. Specimen platforms are set at exactly at 38°C for maintaining core body temperature during testing (VERY IMPORTANT). After enough time is allowed for temperature to stabilize, the correct temperature should register when measured in the middle of the heating platform. Failure to do so, not only compromises the results, but also may be fatal to mice in cases of hyperthermia (especially small mice).
b. Long 5-6" balloons are cut into 4 equal sections of 1 1/3" pieces. These balloon pieces are then installed and threaded through the tail-cuffs. Without stretching the balloons, they are shrunk and customized to fit the tail-cuffs with the use of a heat gun or a lighter.
c. The balloons are checked for holes by pumping air into the tail-cuffs at pressures not greater than 200 mm Hg that remain stable over a given time. In the event that the observed pressure is steadily lost, air is pumped up again and the balloon with the hole is systematically identified using a pair of smooth tubing clamp (not hemostats or forceps as they may damage the tubing) and then replaced.
d. Pressure is calibrated according to manufacturer's protocol. Briefly, by connecting directly the air supply tube to the sphygmomanometer, and inputting the values observed in the attached mercury column, these pressure calibrations are then compared with those displayed on the computer following inflations of the tail-cuff balloons at appropriate pressures.
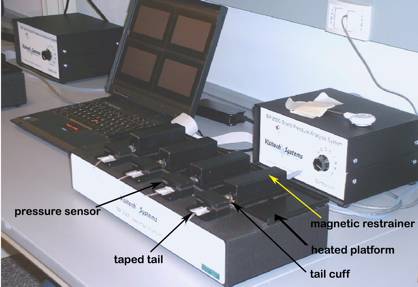
Figure 1. The Visitech System for blood pressure and pulse measurements in mice.
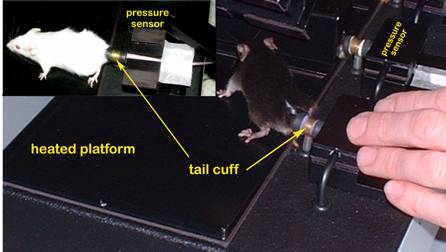
Figure 2. Mice positioned for blood pressure measurement using tail-cuff method.Obtaining pulse and blood pressure measurements
a. Fully acclimated and trained mice are picked up by their tails and gently placed on a temperature-stabilized (38°C) platform. At least two thermometers are taped in the middle and on the side of the platform and covered with magnetic restrainers to provide additional means to monitor and to assure proper platform temperature.
b. The mice are then restrained in place (without anesthesia) using magnetized holders. Care is taken to prevent the feet from getting pinched by the magnets.
c. To facilitate measurement efficiency, automated 4-stage sphygmomanometers for mice are used to test 4 mice simultaneously in a given session.
d. Once the mice are properly secured, their tails are then passed through the cuffs and the optical hemodrometers, and the exposed proximal tail segments are fixed in place with bandage tape.
e. The mice may be left in the optical position for 5-10 min to promote body temperature stabilization. Any evidence of mouse sweating during measurement is noted, for it is likely indication of non-optimal or un-regulated temperature.
f. The tail-cuff system is then turned ON to begin the process; air is automatically pumped into the balloons, consequently applying pressure on the tail vessels, so that waveforms of blood vessel expansions and contractions can be optically sensed and recorded.
g. Simultaneous recording of systolic blood pressure, diastolic blood pressure, and pulse rate measurements are automatically recorded at least 30 times per session.
h. In order to obtain reliable and accurate representation of blood pressure and pulse rate, measurements are taken the same way and at the same time for 5 consecutive days. Furthermore, to circumvent inherent system-channel idiosyncrasies or variations, the mice are rotated through all 4 stages and in all available machines.
i. After all the data are collected and saved, the bandage tapes are gently removed from the tail so that mice are able to come out on their own off their restraints to be returned to their respective cages. The whole process is executed with the least amount of stress to the mice, while providing them an opportunity to calm down as well.
j. At the end of each session the platforms are cleaned with wet paper towel and then disinfected with "baby-wipes".Data collected by investigator
- pulse rate
- systolic blood pressure
Definitions & formulas
Systolic blood pressure: blood pressure during peak cardiac contraction.
Diastolic blood pressure: blood pressure during peak cardiac distension and relaxation.
Tail pulse: throbbing of the tail arteries as a consequence of heartbeat.
Krege JH, Hodgin JB, Hagaman JR, Smithies O. A noninvasive computerized tail-cuff system for measuring blood pressure in mice. Hypertension 1995;25(5):1111-5. PubMed: 7737724
Sugiyama F, Churchill GA, Li R, Libby LJ, Carver T, Yagami K, John SW, Paigen B. QTL associated with blood pressure, heart rate, and heart weight in CBA/CaJ and BALB/cJ mice. Physiol Genomics. 2002;10(1):5-12. PubMed: 12118100
Lorenz JN. A practical guide to evaluating cardiovascular, renal, and pulmonary function in mice. Am J Physiol Regul Integr Comp Physiol. 2002;282(6):R1565-82. PubMed: 12010737
____________________
Electrocardiogram (ECG) in Conscious Mice
Purpose: To generate Electrocardiographic (ECG) profiles in conscious C57BL/6J-Chr#A/NaJ consomic strains using the using the AnonyMouse ECG screening system.
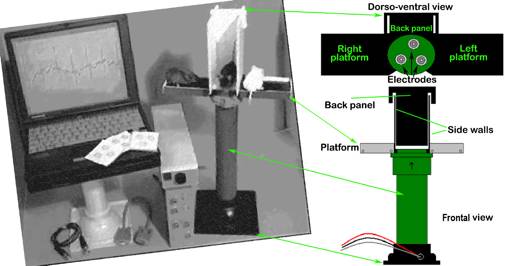
- AnonyMOUSE ECG Screening System, for non-invasively recording electrocardiograms in conscious mice (Mouse Specifics, Inc. 28 State St., Suite 1112, Boston, MA 02109) Additional product information here and also here.
- An array of gel-coated ECG electrodes (Red Dot; 3 M, St. Paul, MN) are embedded in the platform floor and spaced approximately 3 cm in between each other such that forelimb and hindlimb paws can simultaneously come in contact with the electrodes. Filter papers, with openings for the electrodes, are used to prevent mouse urine from short-circuiting the signals. The electrodes are connected to an amplifier (HP78901A, Hewlett-Packard, Andover, MA) by a shielded 3-electrode lead set (M1605A Snap, Hewlett-Packard, Andover, MA). The signals are digitized with 16-bit precision (DI-220, DATAQ Instruments, Inc., Akron, OH) at a sampling rate of 2500 samples/s.
- Data are transmitted to the mousespecifics.com web site (Mouse Specifics, Inc., Boston, MA) using standard file-transfer protocols for ECG signal analyses by e-MOUSE®. e-MOUSE®, an internet-based physiologic waveforms analysis portal, incorporates Fourier analyses and linear time-invariant digital filtering of frequencies below 2Hz and above 100Hz to minimize environmental signal interferences during ECG waveform processing. The software plots its interpretation of P,Q,R,S, and T for each heart beat (see below); so that spurious data resulting from unfiltered noise or motion artifacts may be rejected.
- Additional product information: Mouse Specifics
- Product Showcase
Figure 3. The AnonyMOUSE ECG Screening System for non-invasive measurement of ECG in the mouse.
- Shielded 3-electrode lead set (M1605A Snap, Hewlett-Packard, Andover, MA)
- Lead plates: Snap-Style Pre-Gelled Plates (One Health Care Tech Inc., 8020 Tyler Blvd., Mentor, OH 44060)
- Gel-coated ECG electrodes (Red Dot; 3 M, St. Paul, MN)
- Paper towels or Teri wipe cloth
- Mild detergent
- 70% Alcohol
Acclimation to test conditions
A 10 min period of acclimatization is implemented when using the non-invasive ECG screening system because the novelty of the environment may induce a state of anxiety in conscious mice (manifested by body tremors, shivering, and general increase in activity, all of which may introduce electrical signals that confound acquisition of ECG). Two mice, one placed on each side of the tower platform, are acclimated at the same time. As the mice become acclimated to the test conditions, they tend to become more relaxed, and more likely to contact the electrode pads, which promote recordable ECG signal.
Procedure: Electrocardiograms (ECG) in conscious mice using the AnonyMouse ECG screening system
To measure electrocardiographic (ECG) parameters in conscious, unanesthetized, and unrestrained 11wk-old mice, the AnonyMouse ECG screening system is used. The success of obtaining recordable data depends upon properly acclimatizing the mice to the testing conditions, and properly positioning the paws to be in full contact with the electrodes
Staging mice for ECG recording
a. Mice are gently removed from their cages, picked up by their tails, and propped on the ECG platform with the least amount of provoked anxiety and stress and then allowed to acclimate for 10 min.
b. An acclimated mouse is then gently prodded and positioned at the center of the platform such that the paws come in contact with the three electrodes using a small wooden stick with a cotton swab on one end. The two front paws and left hind paw in contact with the lead plates with the mouse standing, not sitting, are optimized testing conditions.
c. The ECG system is then turned ON, started and operated according to manufacturer's protocol. While waiting for signals to appear, another mouse is gently placed on the vacated side of the platform to acclimate.
d. The output from the amplifier is scrutinized carefully such that only data from a continuous display of 20-30 ECG signals or waveforms (in 2-3s) are recorded and used in the analyses.
e. At the end of each session, the tower and platform is disassembled by its various parts (shields, platform, lead plate) for cleaning using mild detergent and paper towels, and then disinfected and allowed to dry with alcohol. The lead plate wherein the electrodes are attached are kept and not thrown away, while the gel-coated ECG electrodes are periodically changed and replaced.
f. The cleaned platform is assembled for the next session. A piece of paper towel is placed beneath the back shield and on each sidewall of the platform to protect it from soiling. The distance of the back shield to the platform is adjusted according to the size, such that the closest channel to the platform is used for small to medium sized mice, and one channel farthest back is used for larger mice.ECG data analyses and definitions using e-MOUSE®
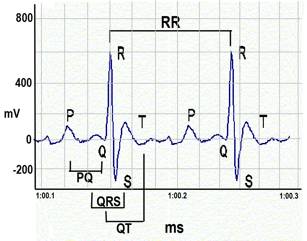
Figure 4. ECG waveforms.a. Heart rate is calculated using the number of R-wave peaks.
b. Heart rate variability is calculated as the average of the differences between a given series of heart rates from a set of ECG signals or waveforms.
c. QRS complex is automatically determined from the beginning of a Q-wave peak to the end of the S-wave peak.
d. QT interval is defined as the segment in ECG waveform beginning at the peak of the Q-wave, including the inverted and/or biphasic portions of the T-wave, and ending at the peak of the T-wave.
e. The end of the T-wave of each ECG waveform is defined as the point where the T-wave returns to baseline or isoelectric line.
f. Isoelectric line or baseline is defined as the average voltage between the preceding P-wave and the QRS interval.
g. The QT intervals are rate corrected (QTc) by application of the equation recommended by Mitchell et al. for use in mice.
h. For more details: Jaxwest1 protocol or Hampton1 protocolData collected by investigator
Electrocardiographic (ECG) waveforms, ECG waveform intervals, and heart rates.
Gehrmann J, Hammer PE, Maguire CT, Wakimoto H, Triedman JK, Berul CI. Phenotypic screening for heart rate variability in the mouse. Am J Physiol Heart Circ Physiol. 2000 Aug;279(2):H733-40. PubMed: 10924073
Bestetti RB, Oliveira JS. The surface electrocardiogram: a simple and reliable method for detecting overt and latent heart disease in rats. Braz J Med Biol Res. 1990;23:1213-22. PubMed: 2136553
Braun A, Trigatti BL, Post MJ, Sato K, Simons M, Edelberg JM, Rosenberg RD, Schrenzel M, Krieger M. Loss of SR-BI expression leads to the early onset of occlusive atherosclerotic coronary artery disease, spontaneous myocardial infarctions, severe cardiac dysfunction, and premature death in apolipoprotein E-deficient mice. Circ Res. 2002;90:270-6. PubMed: 11861414
Chu V, Otero JM, Lopez O, Morgan JP, Amende I, Hampton TG. Method for non-invasively recording electrocardiograms in conscious mice. BMCH Physiol. 2001;1(1):6.PubMed: 12362417
Chu, V, Otero, J, Lopez, O, Sullivan, MF, Morgan, JP, Amende, I, Hampton, TG. Electrocardiographic findings in mdx mice: A cardiac phenotype of Duchenne muscular dystrophy. Muscle Nerve 2002;26:513-519. PubMed: 11476671
Desai KH, Sato R, Schauble E, Barsh GS, Kobilka BK, Bernstein D. Cardiovascular indexes in the mouse at rest and with exercise: new tools to study models of cardiac disease. Am J Physiol. 1997;272:H1053-61. PubMed: 9124413
Mitchell GF, Jeron A, Koren G. Measurement of heart rate and Q-T interval in the conscious mouse. Am J Physiol. 1998 Mar;274(3 Pt 2):H747-51. Pubmed: 9530184
Wang L, Swirp S, Duff H. Age-dependent response of the electrocardiogram to K(+) channel blockers in mice. Am J Physiol. 2000;278:C73-80. PubMed: 10644514