Jones1 project protocol
Screening vestibular function using evoked potentials in 16 inbred strains of mice (2003)
Jones SM, Johnson KR, Jones TA, Erway LCWith: Yu H, Avniel W, Hartsock M, Tregear K
Project protocol — Contents
Workflow and sampling
Equipment and consumables
Procedure
Data
Definitions
References
Workflow
Mice are brought from the vivarium to the test room to acclimate before testing begins Mice are weighed to determine anesthetic dose After mice are completely sedated, they are prepared for surgery, positioned and set-up for VsEPs testing Mice are kept in thermostatically controlled heating pad until they fully recover VsEPs testing system is cleaned before subsequent use • Balance scale
• Disinfectant or cleaning solution
• Syringe with 30 gauge needle
• Anesthetic: EquiThesin (4 µL/g bw, (mixture of sodium pentobarbital, chloral hydrate, propylene glycol, magnesium sulfate, ethanol, and water; see Jones et al.,1997 for complete recipe)
• Small rodent surgical pack (scissors, forceps, scalpels, retractors, bone drill/rongeurs, etc.)
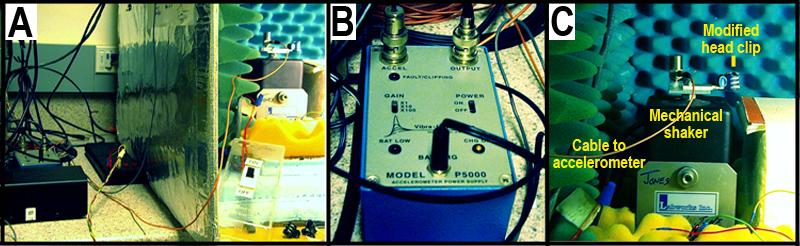
Figure 1 A shows the mechanical shaker and the accelerometer setup. Panel B. Closeup image of the accelerometer. Panel C. Layout of the mechanical shaker.• Mechanical shaker for delivering motion stimuli (Labworks, Inc. Model ET2-203), see Figure 1 A-C above
• Accelerometer (see Figure 1 B above)
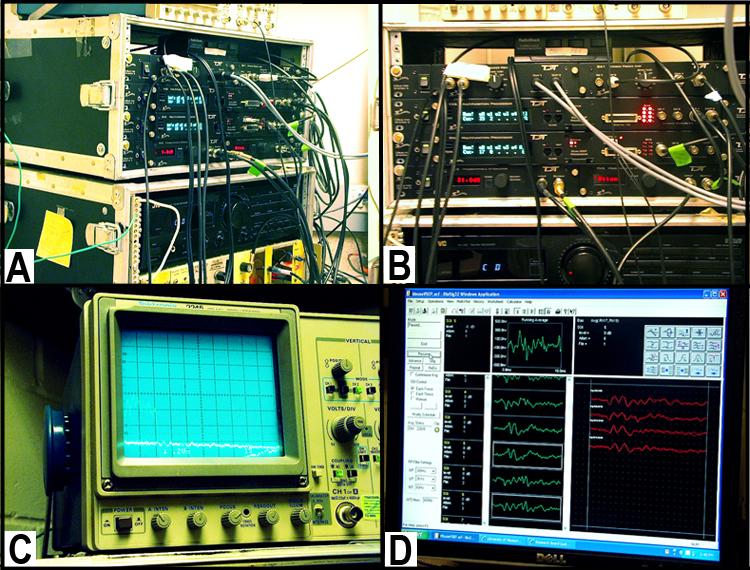
Figures 2 A & B are photographs of the electrical signal amplifier setup. Panel C. Display screen for amplified signals. Panel D. Computer screen illustrating the signal output as well as the stimulus generated.• Electrical signal amplifier: differential preamplifier (Grass P511 Model K) see Figures 2 A - C above
• Vestibular stimulus generator: stimuli are generated and controlled using custom software and Tucker Davis Technologies (TDT, Gainesville, FL) modules (TG6, DA3-2, PA4); response signals are sampled following the onset of each stimulus (A/D conversion: 1024 points at 10 ms/ point, TDT AD1 module) to produce a 10.24 ms response epoch, see Figure 2 D above
• Computer
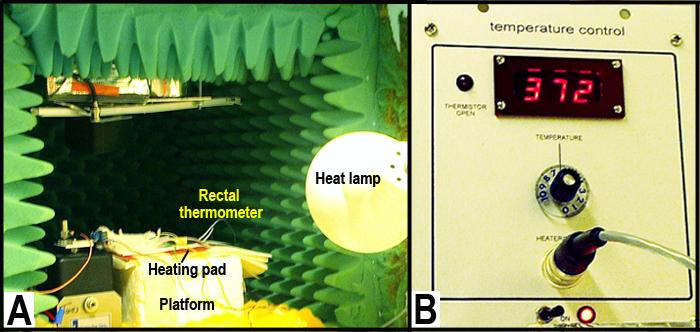
Figure 3 A depicts the layout for temperature control and Figure 3 B is a closeup of the temperature sensor and control.• Heating pad, see Figure 3 A above
• Customized aluminum plate for coupling head to mechanical shaker (optional)
• Head mount or modified head clip
• Dental acrylic
• Thumbscrew, stainless steel screws
• Stainless steel electrodesI. Pre-surgical and surgical Preparation
a. Mice are weighed and then anesthetized with EquiThesin (4 µl/g body weight injected intraperitoneally (i.p.)).
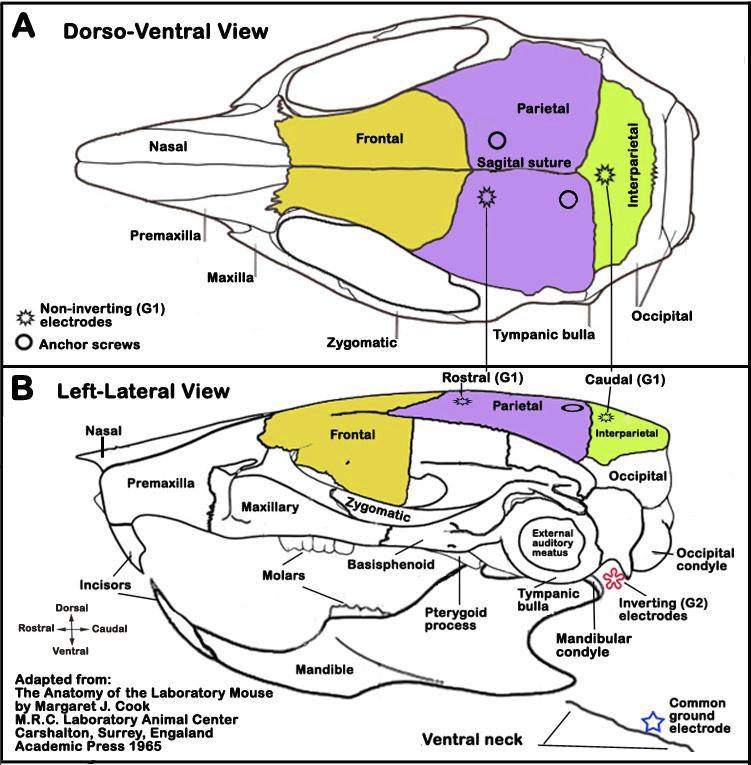
b. An incision is made in the skin overlying the skull and the skin is retracted to reveal the sagittal (see Figure 4 A below) and coronal skull sutures.
c. Two holes are drilled at the vertex near the midline to expose the dura and bare stainless steel (0.127 mm diameter) wires are coiled and inserted in the epidural space and the holes are sealed with bone wax. These electrodes are used as the noninverting (G1) electrodes (see Figure 4).
d. Subcutaneous electrodes are placed behind the left and right ear pinna (inverting leads (G2) for two channel recordings), and under the chin (common ground electrode) or ventral neck (see Figure 4 B).
e. Two small pilot holes are drilled on the midline rostral and caudal to the coronal suture to insert self-tapping stainless steel screws that served as anchors for dental acrylic.
f. The dental acrylic is poured over the area to cement a thumbscrew into place over the vertex. The thumbscrew is used to mechanically couple the mouse's head firmly to the mechanical shaker platform.
g. The animal is then placed supine-ventro-dorsal position on the pre-heated platform, while the head is oriented with the nose pointed dorsally (see Figure 5 below).
h.The heated platform is adjusted to keep the core body temperature at 35-39°C.
i. A head mount is placed on the cranium using methods published previously (Jones and Jones, 1999; Jones et al., 2002). The head mount is used to couple the cranium securely to a mechanical shaker for precise and controlled stimulation to the head.
Figure 4. Schematic illustrations of electrode placements in the head. Panel A. Dorso-ventral view of the head showing the locations of two (rostral, caudal) non-inverting (G1) electrodes. Panel B. Left-lateral view of the head showing approximate locations of an inverting (G2) electrode (red asterisk) and common ground electrode (blue star).
II. Measurement of VsEPs
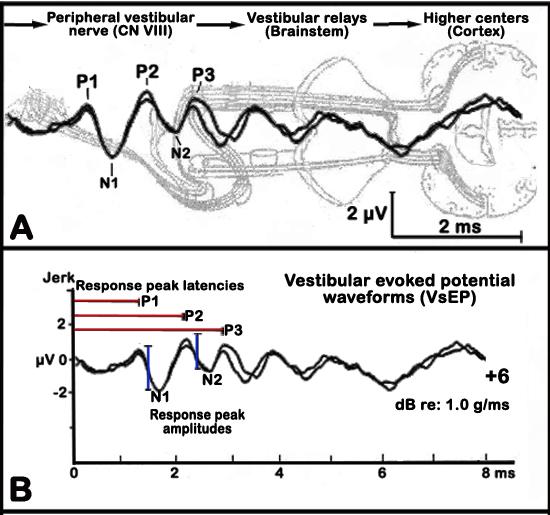
Linear VsEPs are compound action potentials from the vestibular portion of the eighth cranial nerve (CN VIII) and central relays and are generated in response to motion stimulus. These VsEPs depend strictly upon the integrity of the utricle and saccule (gravity receptors) of the inner ear. The first response peak reflect activity of the peripheral vestibular nerve, whereas later response peaks reflect activity of vestibular relays within the brainstem and higher centers, which are recorded much like the more common auditory brainstem response or ABR (see Figure 6 below, Jones et al. 2005).
a. After securing or coupling the head to the mechanical shaker with anchoring screws, motion stimuli are delivered to the head (Jones, 1992; Jones and Jones, 1996; Jones et al., 1997).
b. Linear up-and-down jerk stimulus pulses of 2 ms duration are applied to the head via naso-occipital axis at a rate of 16 linear jerks/s. Hence, head motion is alternated in a downward and upward directions.
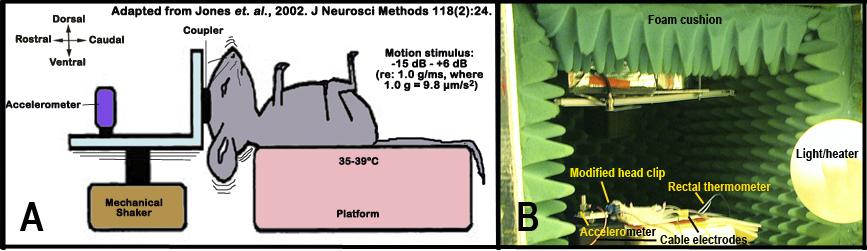
c. A calibrated accelerometer is then mounted on the stimulus platform and used to monitor the acceleration of the stimuli. The output of the calibrated accelerometer is then routed to an electronic differentiator to monitor the jerk component (i.e., the first derivative of acceleration) of the stimulus. The accelerometer is calibrated using known jerk stimuli that is linear over ranges of amplitudes; the stimulus intensity ranges from -15 dB to +6 dB re: 1.0 g/ms (where 1.0 g= 9.8 µm/s2) adjustable in 3 dB steps. Stimulus amplitude is quantified in decibels relative to 1.0 g/ms (1.0 g = 9.8 µm/ms2). Maximum stimulus amplitude of +6 dB re: 1.0 g/ms, corresponds to a peak acceleration of 4 g and calculated peak platform displacement of 26 µm (Jones et al., 2002).
d. Two stimulus polarities, normal and inverted, are used. Normal polarity stimuli are defined as an initial upward jerk whereas inverted stimuli as an initial downward jerk.
e. Two-channel signal averaging is used to extract the vestibular responses from the background activity.
f. Electrophysiological activity is amplified (200 000X), filtered (300-3000 Hz, -6 dB points), and digitized (125,000 Hz) beginning at the onset of each jerk stimulus (1024 points, 8 µs per point) to produce one primary response trace or waveform.
g. 256 primary responses are averaged to produce an averaged response waveform for a given stimulus intensity and polarity.
h. Responses are replicated such that two averaged response waveforms are recorded/collected for each stimulus intensity (a waveform recorded for normal stimulus polarity and a waveform for inverted polarity). Final individual response traces are produced off-line by summing one averaged response to each stimulus polarity and dividing the result by 2, thus producing two response traces for every stimulus intensity.
i. A threshold seeking protocol is then used where stimulus intensity began at +6 dB and waveforms are collected in quiet (no sound stimulus) and in the presence of an intense sound stimulus or masker (50 to 50,000 Hz, 116 dB SPL). The masker is used to verify the absence of auditory responses.
j. Subsequent stimulus level is reduced in 6 dB steps until no response could be detected by visual inspection of the waveform.
k. At that point, the stimulus intensity is reduced an additional 3 dB and waveforms are collected for intensity steps midway between those already used. In this manner, intensity series in 3 dB steps encompassing stimulus levels above and below thresholds can be collected.
Figure 5 A shows a schematic illustrations of the vestibular evoked potential (VsEP) measurement set-up. Figure 5 B depicts an image of the actual set-up. Note: the testing chamber is lined with foam cushions to minimized extraneous noise and electrical interference.
III. Quantification of VsEP waveforms
a. The first three positive and negative response peaks are analyzed (see Figure 6 below).
b. Response peak latencies are measured in milliseconds (ms) from the onset of the stimulus to each positive response peak (labeled P1, P2, and P3) and negative (labeled N1 to N3) peaks. Latencies provide a measure of the timing of neural transmission and conduction through the vestibular neural pathways.
c. Peak to peak amplitudes are measured in microvolts (µV) by subtracting the amplitude of the negative peak from its corresponding positive peak (labeled P1/ N1, P2/N2, P3/N3). Amplitudes reflect the size and general synchrony of the population of neurons responding to the stimulus.
d. Thresholds are measured in decibels (re: 1.0 g/ms is defined as the stimulus level midway between the jerk amplitude just producing a discernible response and that stimulus level which did not. Thresholds provide a measure of the general sensitivity of the gravity receptor system.
Figure 6. Graphic illustrations of the vestibular evoked potential (VsEP) waveforms. Panel A. Activated regions corresponding to given response peaks. Panel B. Analysis of VsEP waveforms showing response peak latencies (red lines) and response peak amplitudes (blue lines).Data collected by investigator
- threshold stimulus response level
- latency of positive evoked potentials for peaks 1, 2, and 3
- amplitude of evoked potentials for peaks 1 and 2
Definitions and calculations
Thresholds are defined as the intensity midway between the minimum intensity producing a response and the maximum intensity failing to produce a response.
Response peak latencies are measured in milliseconds from stimulus onset to the occurrence of positive (labeled P1 to P3) and negative (labeled N1 to N3) peaks.
Peak-to-peak amplitudes are measured in microvolts by subtracting the amplitude of the negative peak from its corresponding positive peak (labeled P1/ N1, P2/N2, P3/N3).