Jaxpheno11: Early stages of type 2 diabetes in C57BL/6J male mice on a high-fat diet (2017)
Jackson Laboratory Andrew J SchileClick on "Download" link or button below, to see the available downloads for this project.
| Institutional authorship | Jackson Laboratory |
| Investigators |
Andrew J Schile The Jackson Laboratory -- West, Sacramento, CA |
| Contact | Andrew J Schile andrew.schile@jax.org |
| Affiliated Center | JAX Mice Clinical and Research Services (JMCRS) |
| One-strain study | |
| MPD identifiers | Jaxpheno11 MPD:591 |
| No updates/corrections. Initial release date: 01/2017. | |
|
Click above to copy-paste the entire citation for this MPD web page. |
Purpose: To assess effects relevant to type 2 diabetes on C57BL/6J male mice fed a high-fat diet between the ages of 6 and 30 weeks. C57BL/6J mice receiving 60 kcal% fat are referred to as 'diet-induced obese' (DIO) and have a special JAX number (380050), and the control mice are fed 10 kcal% fat diet (380056). Mice were screened for obesity, non-fasting glucose levels, and glucose intolerance; serum total cholesterol, HDL cholesterol, and triglycerides; and splenocyte populations. See summary results below. Per-animal data are available in the download file.
Methods
Diet administration: Mice are fed either 60 kcal% fat (Research Diets, Inc. D12492) or 10 kcal% fat (Research Diets, Inc. D12450B) starting at 6 weeks of age and continuing through 30 weeks.
Body weight: At least 40 mice per diet and age are measured on the same day each week.
Non-fasted blood glucose: Glucose levels are determined weekly on at least 40 non-fasted mice per diet and age. Submandibular blood glucose measurements are obtained using a OneTouch Ultra 2 or UltraMini hand-held glucometer which is validated with a control solution on each day of use.
Body composition: Mice are analyzed using a Lunar PIXImus DEXA scanner. Calculations of body composition exclude the head. Values represent mean and one standard deviation of 10 non-fasted mice per diet and age.
Clinical chemistry: All values are measured from serum collected from submandibular blood except HbA1c, which is measured from submandibular whole blood. Ten to twenty non-fasted mice are tested per age and diet group. Results are obtained using a Beckman Coulter AU680 chemistry analyzer.
Spleen flow cytometry: All cell populations are calculated as percentages of the total viable splenocyte population, except for regulatory T cells which are calculated as the percentage of viable CD4+ cells. Values represent mean and one standard deviation of 10 mice per age and diet group. Parameters are measured using a BD Biosciences LSR II flow cytometer.
Available download (per animal data):
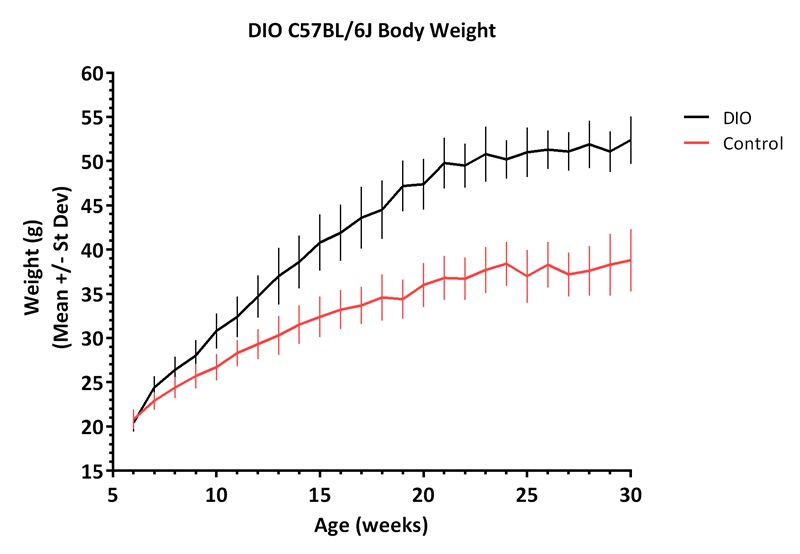
Figure 1. Body weight and growth curve. Values represent mean and one standard deviation of at least 40 mice per diet and age, measured on the same day each week.
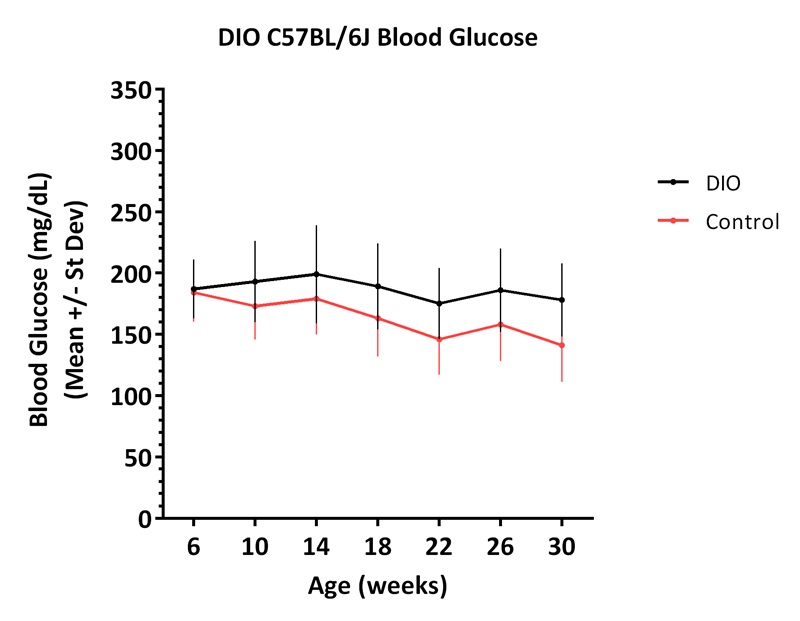
Figure 2. Non-fasted glucose. Values represent mean and standard deviation of at least 40 non-fasted mice per diet and age.
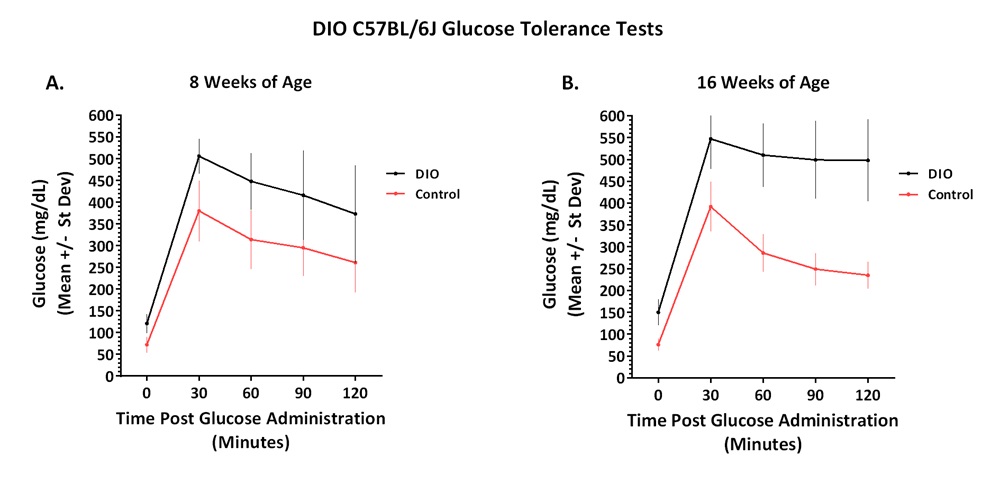
Figure 3. Glucose tolerance test. Blood glucose levels during glucose tolerance tests (GTT) at 8 weeks (A) and 16 weeks (B) of age. Following a 16h fast, an initial submandibular blood glucose reading was taken and mice were administered glucose by IP injection at 2 g/kg body weight. Blood glucose was measured in 30 minute intervals. Values represent mean and one standard deviation of 20 mice per diet and time point. GTT performed on DIO mice at 26 weeks gave similar results as the 16 week timepoint (not shown).
Table 1. Body composition.
Age (wks) Group Body weight (g) Bone mineral density (g/cm2) Bone mineral content (g) Bone area (cm2) Lean tissue (g) Fat tissue (g) Percent fat tissue (%) 8 DIO 28.1 +/- 2.1*** 0.052 +/- 0.002 0.416 +/- 0.028 7.97 +/- 0.39 19.8 +/- 1.2 ** 8.4 +/- 1.1 *** 30.0 +/- 1.8 *** Control 23.4 +/- 1.3*** 0.054 +/- 0.001 0.434 +/- 0.031 8.11 +/- 0.44 18.1 +/- 1.2** 5.3 +/- 0.8 *** 22.6 +/- 3.2 *** 16 DIO 41.5 +/- 3.4*** 0.057 +/- 0.002 0.528 +/- 0.046 9.33 +/- 0.95 22.0 +/- 1.4 19.5 +/- 3.8*** 46.6 +/- 5.7 *** Control 30.8 +/- 2.5*** 0.059 +/- 0.003 0.458 +/- 0.147 8.60 +/- 0.56 22.0 +/- 2.0 8.8 +/- 2.4 *** 28.6 +/- 6.3 *** 26 DIO 51.8 +/- 3.5*** 0.053 +/- 0.002 0.536 +/- 0.045 10.06 +/- 0.79 23.9 +/- 1.5 27.8 +/- 2.8*** 53.8 +/- 2.6 *** Control 38.1 +/- 2.8*** 0.058 +/- 0.002 0.532 +/- 0.031 9.20 +/- 0.38 22.9 +/- 1.2 15.2 +/- 2.1*** 39.8 +/- 3.1 *** Results were analyzed by age using two-way ANOVA with Sidak's multiple comparisons test to identify values that differed significantly between diet groups, using GraphPad Prism version 6.07 for Windows (GraphPad Software). ** p≤0.05; *** p≤0.0001
Table 2. Clinical chemistry.
Age (wks) Group Total cholesterol (mg/dL) HDL cholesterol (mg/dL) LDL cholesterol (mg/dL) Triglycerides (mg/dL) Free fatty acids (mEq/L) Glucose (mg/dL) HbA1c (NGSP%) 8 DIO 173 +/- 23 135 +/- 17 4.6 +/- 0.7 138 +/- 44 1.13 +/- 0.29 215 +/- 39 5.7 +/- 0.3 Control 160 +/- 17 128 +/- 11 4.8 +/- 1.0 119 +/- 45 1.21 +/- 0.29 221 +/- 28 5.7 +/- 0.3 16 DIO 211 +/- 18 *** 150 +/- 10 ** 5.2 +/- 0.7 155 +/- 50 *** 1.18 +/- 0.24 249 +/- 44 *** 6.4 +/- 0.4 Control 161 +/- 23 *** 121 +/- 13 ** 5.9 +/- 1.0 106 +/- 30 *** 0.96 +/- 0.24 202 +/- 25 *** 5.8 +/- 0.6 26 DIO 257 +/- 45 *** 168 +/- 23 * 9.8 +.- 3.4 152 +/- 34 *** 1.02 +/- 0.28 230 +/- 49 ** 6.7 +/- 0.2 Control 191 +/- 25 *** 139 +/- 13 * 7.4 +/- 1.8 98 +/- 26 *** 0.81 +/- 0.19 195 +/- 22 ** 6.1 +/- 0.3 Results were analyzed by age using two-way ANOVA with Sidak's multiple comparisons test to identify values that differed significantly between diet groups, using GraphPad Prism version 6.07 for Windows (GraphPad Software). * p≤0.1; ** p≤0.05; *** p≤0.0001
Table 3. Spleen flow cytometry.
Age (wks) Group B cells (B220+) T cells (CD3e+) Helper T cells (CD3e+, CD4+) Cytotoxic T cells (CD3e+, CD8+) Regulatory T cells (CD3e+, CD4+, CD25+) NK T cells (CD3e+, CD49b+) 8
DIO
58.9 +/- 2.6 23.7 +/- 1.8 14.5 +/- 1.3 8.04 +/- 0.65 12.3 +/- 0.8 0.25 +/- 0.03 Control 58.4 +/- 2.4 26.7 +/- 2.7 16.7 +/- 1.8 8.87 +/- 0.88 12.8 +/- 0.6 0.31 +/- 0.08 16 DIO 65.4 +/- 5.5 20.8 +/- 2.5 12.2 +/- 1.6 7.19 +/- 0.89 16.0 +/- 1.2 0.19 +/- 0.03 Control 61.2 +/- 3.6 22.8 +/- 4.4 13.4 +/- 2.8 7.96 +/- 1.61 16.8 +/- 1.8 0.19 +/- 0.02 26 DIO 65.1 +/- 2.5 18.5 +/- 1.3 10.9 +/- 0.9 6.30 +/- 0.70 15.9 +/- 1.2 0.13 +/- 0.03 Control 63.6 +/- 1.9 23.7 +/- 2.0 13.8 +/- 1.5 8.45 +/- 0.69 15.8 +/- 0.8 0.17 +/- 0.04
Age (wks) Group Monocytes (CD11b+, SSClo, Gr1) NK cells (CD3-, B220-, CD49b+) Dendritic cells (CD11b+, SSClo, CD11c+) Neutrophils/ granulocytes (CD11b+, Gr-1+) Eosinophils (CD11b+, SSChi) Plasmacytoid dendritic cells (B220+, CD11c+) 8
DIO
1.16 +/- 0.18 1.33 +/- 0.17 0.68 +/- 0.10 5.66 +/- 0.93 0.11 +/- 0.02 1.50 +/- 0.09 Control 1.17 +/- 0.18 1.59 +/- 0.16 0.60 +/- 0.08 3.61 +/- 0.94 0.10 +/- 0.02 1.43 +/- 0.30 16 DIO 1.22 +/- 0.23 0.94 +/- 0.12 0.63 +/- 0.13 4.02 +/- 1.05 0.17 +/- 0.06 0.98 +/- 0.17 Control 1.50 +/- 0.39 1.22 +/- 0.17 0.51 +/- 0.09 4.59 +/- 1.26 0.23 +/- 0.09 0.87 +/- 0.26 26 DIO 1.45 +/- 0.21 0.66 +/- 0.11 0.55 +/- 0.09 3.14 +/- 0.42 0.13 +/- 0.03 0.83 +/- 0.25 Control 1.16 +/- 0.23 0.99 +/- 0.15 0.64 +/- 0.10 2.68 +/- 0.53 0.12 +/- 0.04 0.96 +/- 0.25