Donahue2 project protocol
Characterization of skeletal geometry and bone strength in 10 inbred strains of mice (2004)
Donahue L, Beamer WG, Bogue MA, Churchill GAWith: Tsaih S-W, Sears AR, MacKenzie GW
Project protocol — Contents
Workflow and sampling
Equipment
Reagents, supplies, and solutions
Procedures
Definitions & formulas
Data
References
Workflow and samplingWorkflow
Left proximal hindlimbs are then dissected and freed of muscle and connective tissues to isolate the left femur
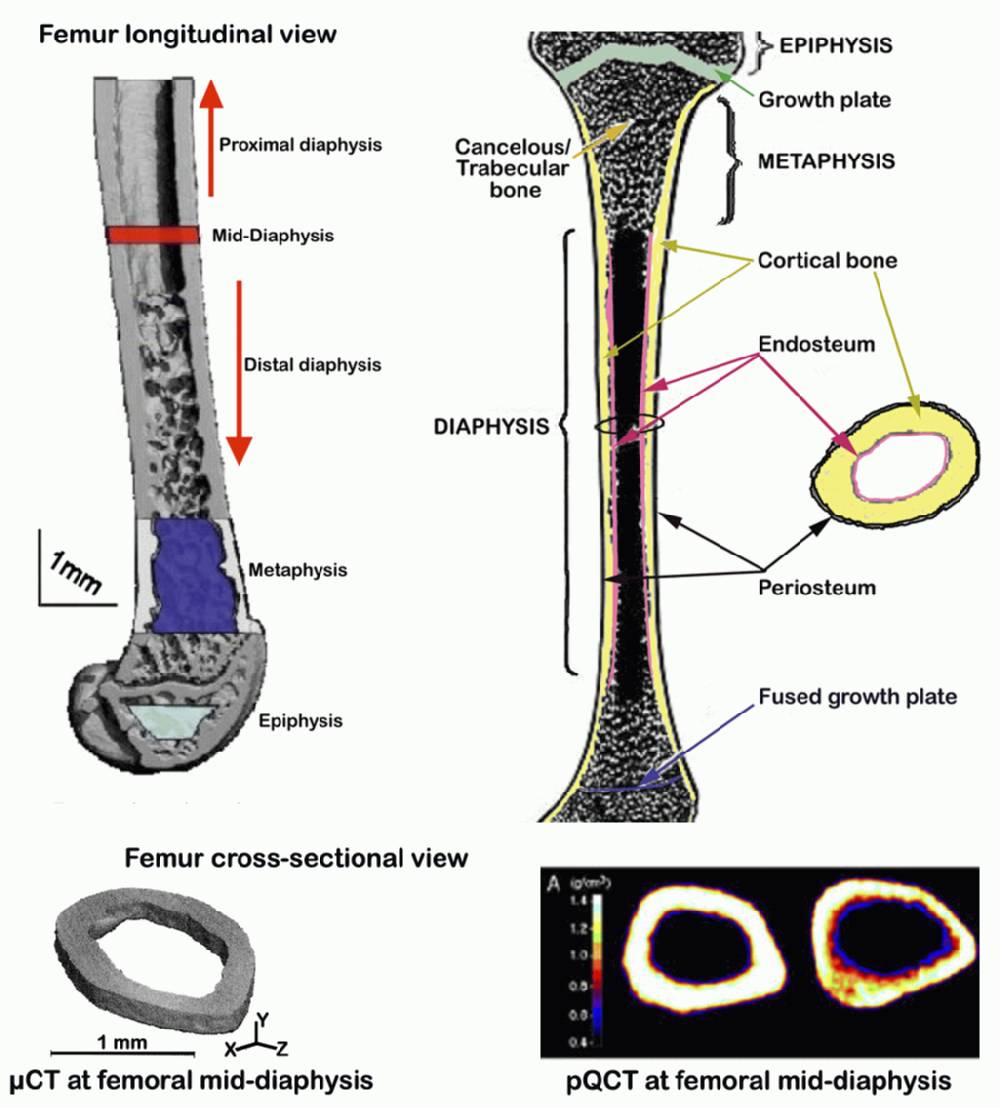
femoral length, anterior-posterior (rostral-caudal) width, and medial-lateral width; vBMD of whole and cortical femur After at least 2 wks right femurs are measured for cross-sectional geometry, volumetric density, and bone content at mid-diaphysis inner/outer circumference, cortical thickness, vBMD, and BMC at mid-shaft
- Top loading balance: Ohaus Portable Navigator Series Electronic, Model NV-210 (Ohaus Corp., Pine Brook, NJ) for measuring body weights.
- Mettler H-30 analytical balance (accurate to within 0.1 mg) that is routinely calibrated with known standard weights
- Digital hand calipers (Stoelting, Wood Dale, IL, USA)
- MTS Systems Qtest/1L instrument and TestWorks software (vers. 4) (Eden Prairie, MN), for testing biomechanical properties of bones
- Microcomputed Tomography (µCT40, Scanco Medical AG, Bassersdorf, Switzerland) for evaluating cross-sectional geometry of bones
- Heavy-duty sharp decapitating scissors and small animal dissecting kit
- Stratec SA Plus pQCT densitometer (Orthometrix, Inc., White Plains, NY)
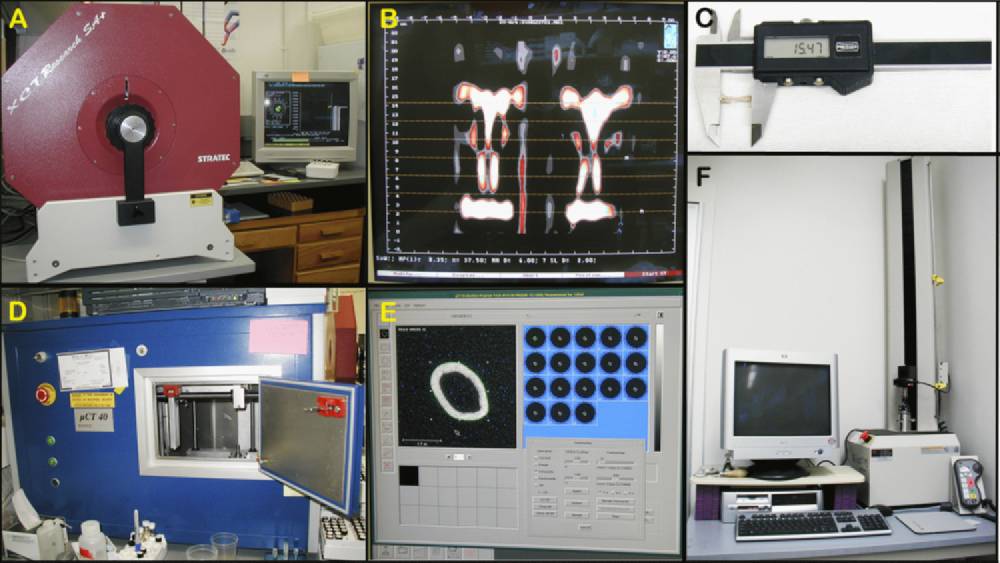
Figure 1 A: Stratatec SA+ peripheral quantitative computed tomography (pQCT) for measuring entire cross-sectional area of the mid-thigh muscle. Figure 1 B: Screen output example from pQCT. Figure 1 C: Digital hand caliper for measuring bone dimensions. Figure 1 D: µCT 40 for assessing bone geometry and density. Figure 1 E: Screen output example from µCT 40. Figure 1 F: MTS system for testing biomechanical properties of bones.
- 1% KOH for macerating and clearing tissues around bones
- Alizarin red dye for staining skeletal preparations
- Glycerin for storing skeletal preparations
- Physiological saline solution: 0.85% NaCl, for thawing frozen tissues and for keeping them moist
- 95% EtOH
Acclimation to test conditions
Mice are are acclimated to housing conditions until 16 wks of age and then to testing conditions for at least 0.5 h.
I. Preliminary measurements, dissections, and bone preparations
a. Adult 16-wk old mice are weighed using a top-loading scale.
b. After recording individual body weights, the mice are euthanized by decapitation using a sharp gauze scissors.
c. The bodies are then necropsied for any gross morphological abnormalities.
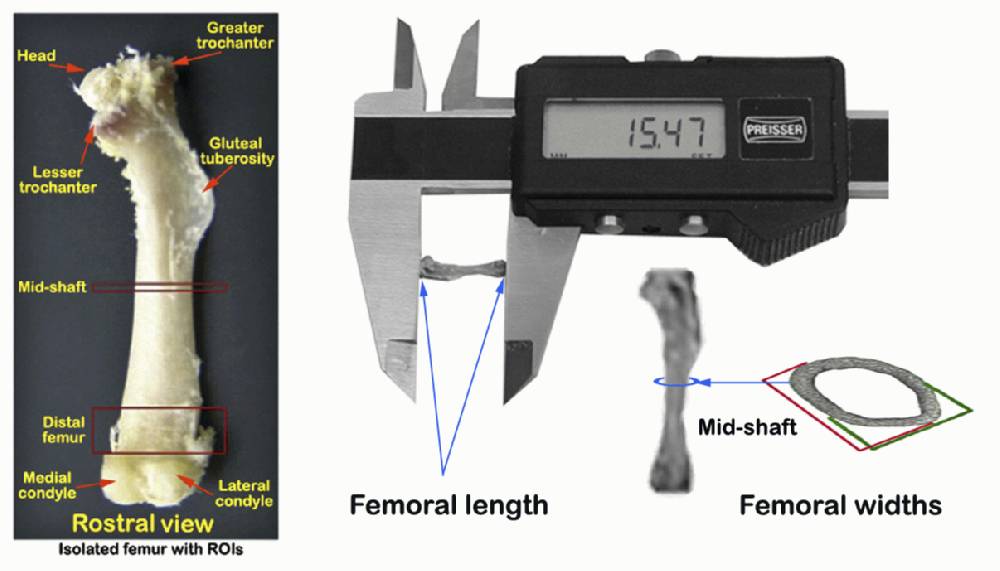
d. Apparently healthy hindlimbs are skinned and harvested (see schematic diagram in Figure 2 A) and then further processed according to phenotypic measurements to be obtained.
e. Left hindlimbs are skinned, wrapped in physiological saline-soked gauze to prevent desiccation, and then stored frozen in -20°C for for later measurements.
f. The remaining right hindlimbs are also skinned and then immediately placed in the Stratec SA Plus peripheral quantitative computed tomography (pQCT) densitometer (see Figure 1 A-B above) to obtain mid-thigh area measurements.
g. Three scans are obtained at 1 mm intervals at the mid point of the diaphysis such that estimated cross-sectional muscle area measurements, the mid-diaphysis cross-sectional area are determined and then subtracted from measured values of thigh areas.
h. No correction factor for the cross-sectional muscle area is applied due to the inability of the SA Plus to sufficiently discriminate and quantify the small areas occupied by deep tissue vessels, nerves, and surrounding fat.
i. After right mid-thigh area measurements are obtained, the right gastrocnemius muscles are dissected, harvested (see example in Figure 2 B), and weighed using an analytical balance.
j. Remaining right thighs are further dissected free of all muscle and connective tissues to isolate the femoral bones (see landmarks in Figure 2 A and C).
k. Dimensions, including femoral lengths, rostral-caudal (anterior-posterior) widths, and medial-lateral widths at mid-diaphysis, are then taken from freshly isolated right femoral bones using a hand-held digital calipers as illustrated below.
l. After recording right (mid-shaft) femoral bone metrics, the right femoral bones are placed in 95% EtOH for at least 2 wks to remove fat contents.
II. Measurements of cross-sectional volumetric bone mineral density (vBMD) using Stratec SA Plus pQCT densitometer
In pQCT, as in DXA proper, quality control and calibration steps are necessary and performed according manufacturer's instruction.
a. Femurs incubated in 95% EtOH for at least 2 wks are scanned at mid-shaft to obtain cortical thickness, using pQCT (see Figure below).
b. In addition to cortical thickness, cross-sectional geometry (inner/outer circumference), volumetric bone mineral density (vBMD), and bone mineral content (BMC) at mid-diapysis are also obtained (see Figure below).
c. To obtain cortical bone areas and surfaces, an outer (and inner) threshold of 710 mg/cm3, which allows the separation of bones from soft tissues, is used because of resulting values are consistent with histomorphometrically-derived values.
d. To determine femoral bone mineral contents (BMC), a second scan analysis is carried out with an outer and lower threshold setting of 220 mg/cm3, such that minerals from most partial voxels (0.07 mm) are included in the analysis.
III. Measurements of whole femur vBMD and cortical VMD and biomechanical properties
a. Frozen left thighs are thawed in fresh saline solution.
b. As in step I-f above, the freshly thawed hindlimbs are placed in pQCT) densitometer to obtain mid-thigh area measurements.
c. After obtaining cross-sectional thigh (bone and muscle) areas, muscle and connective tissues are removed to isolate the left femoral bones.
d. Isolated femoral bones are then scanned to obtain whole femur vBMD, cortical vBMD, and cortical thickness using pQCT densitometer.
e. As in steps II-c-d above, bones scans are analyzed with two different outer threshold settings to separate bone from soft tissue densities.
f. Following whole femur volumetric bone mineral density measurements, the bones are also measured for femoral length and widths as in step I-k above for the right femur.
g. After obtaining femoral bone metrics, the femurs are subjected to three point bending tests for biomechanical properties using a MTS Systems ‘Qtest/1L instrument (see Figure 1 F above).
h. Femurs are placed with condyles down and centered on stationary supports 6 mm apart.
i. Force is applied at 0.05 mm/sec to obtain the force displacement relationship using the 100 g load cell for each bone.
j. Force displacement curves are then generated for each femur.
k. Resulting measurement data are analyzed using the manufacturer's supplied TestWorks®4 software.
IV. Measurement of femoral cortical thickness using µCT 40 for validation
a. Femurs incubated in 95% EtOH for at least 2 wks are also scanned at mid-shaft using µCT 40 (see Figure 1 D and E above).
b. Initially the femurs are scanned at low resolution, with an energy level of 55KeV, an isotropic pixel size of 12 µm, and slice thickness of 12 µm.
c. The values obtained above are then used to calculate the cortical thickness (µm) of the femurs at mid-diaphysis, to be compared with values obtained using pQCT.Submitting investigator's notes: Precision of the pQCT SA Plus for repeated measurement of a single femur was found to be 1.2%. Due to variation in femur lengths, the femoral head could not be scanned at the same location for each bone, and thus was not included in final data. Midshaft values were determined from the midpoint slice, typically slice 4. We found that correlation between total and cortical vBMD values at the mid diaphysis was very high and nearly identical for females (r = 0.923) and males (r = 0.929, Beamer, unpublished data). Therefore, mid-diaphyseal total vBMD, which captures all mineral (subcortical and cortical) as well as all volume (subcortical, cortical, and marrow) was used for subsequent data analyses.
Safety
For safety, gloves must be worn and radiation safety guidelines are strictly adhered to, such that technicians must be behind portable shields. A dosimetry badge and ring must also be worn. Since both the scanning equipment and the computer present icons that indicate the "ON" status of the X-ray tube with open shutters, precautions and any possibility of exposure should be avoided.
ROI = region of interest
Total volumetric mineral density (vBMD) values are calculated by dividing the total mineral content by the total bone volume (bone and marrow) and expressed as mg/mm3.
BMD = BMC ÷ bone areaData collected by investigator
Femoral bone dimensions (length, width (anterior-posterior, medial-lateral), cross sectional area), cortical thickness (right and left femur), femoral bone circumference (periosteal, endosteal), bone mineral density (BMD) of whole (left) femur, BMD of left cortical shell, right femur bone mineral density (BMD) and content (BMC) at mid-diaphysis.
Weight of isolated quadriceps muscle, total thigh and thigh muscle areas in cross section at mid-diaphysis, femoral bone biomechanical properties (displacement curve, break point, 95% break load, displacement), and femoral bone strength and fragility (intrinsic stiffness, extrinsic stiffness, ultimate force, modulus of toughness, work to failure) from isolated femoral bones.
References
Bouxsein ML, Uchiyama T, Rosen CJ, Shultz KL, Donahue LR, Turner CH, Sen S, Churchill GA, Muller R, Beamer WG. Mapping quantitative trait loci for vertebral trabecular bone volume fraction and microarchitecture in mice. J Bone Miner Res. 2004 Apr;19(4):587-99. Epub 2003 Dec 22.
PubMed 15005846 Garman R, Gaudette G, Donahue LR, Rubin C, Judex S. Low-level accelerations applied in the absence of weight bearing can enhance trabecular bone formation. J Orthop Res. 2007 Jun;25(6):732-40.
PubMed 17318899 Judex S, Garman R, Squire M, Donahue LR, Rubin C. Genetically based influences on the site-specific regulation of trabecular and cortical bone morphology. J Bone Miner Res. 2004 Apr;19(4):600-6. Epub 2004 Jan 5.
PubMed 15005847 Judex S, Zhong N, Squire ME, Ye K, Donahue LR, Hadjiargyrou M, Rubin CT. Mechanical modulation of molecular signals which regulate anabolic and catabolic activity in bone tissue. J Cell Biochem. 2005 Apr 1;94(5):982-94.
PubMed 15597385 Kohler T, Stauber M, Donahue LR, Müller R. Automated compartmental analysis for high-throughput skeletal phenotyping in femora of genetic mouse models. Bone. 2007 Oct;41(4):659-67. Epub 2007 Jun 23.
PubMed 17662679 Koller DL, Schriefer J, Sun Q, Shultz KL, Donahue LR, Rosen CJ, Foroud T, Beamer WG, Turner CH. Genetic effects for femoral biomechanics, structure, and density in C57BL/6J and C3H/HeJ inbred mouse strains. J Bone Miner Res. 2003 Oct;18(10):1758-65.
PubMed 14584885 Schneider P, Stauber M, Voide R, Stampanoni M, Donahue LR, Müller R. Ultrastructural properties in cortical bone vary greatly in two inbred strains of mice as assessed by synchrotron light based micro- and nano-CT. J Bone Miner Res. 2007 Oct;22(10):1557-70.
PubMed 17605631 Squire M, Donahue LR, Rubin C, Judex S. Genetic variations that regulate bone morphology in the male mouse skeleton do not define its susceptibility to mechanical unloading. Bone. 2004 Dec;35(6):1353-60.
PubMed 15589216 Xie L, Jacobson JM, Choi ES, Busa B, Donahue LR, Miller LM, Rubin CT, Judex S. Low-level mechanical vibrations can influence bone resorption and bone formation in the growing skeleton. Bone. 2006 Nov;39(5):1059-66. Epub 2006 Jul 7.
PubMed 16824816 Zhong N, Garman RA, Squire ME, Donahue LR, Rubin CT, Hadjiargyrou M, Judex S. Gene expression patterns in bone after 4 days of hind-limb unloading in two inbred strains of mice. Aviat Space Environ Med. 2005 Jun;76(6):530-5.
PubMed 15945395