Loos1 project protocol
High-throughput phenotyping of avoidance learning in males of 8 inbred strains of mice (2012)
Loos M, Maroteaux G, Smit A, Verhage MWith: van der Sluis S, Koopmans B, Aarts E, van Gassen K, Geurts A, Largaespada DA, Spruijt BM, Stiedl O, Neuro-BSIK Mouse Phenomics Consortium
Project protocol - Contents
- Workflow and sampling
- Equipment and supplies
- Experimental design
- PhenoTyper cages (description)
- Procedure: PhenoTyper activity monitoring
- Data
Workflow and sampling
Equipment Activity recorded in home cage for 6.5 days PhenoTyper cages and video tracking *Supplementary data are available for this project. See Loos1
Equipment and supplies
- PhenoTyper cages (model 3000, Noldus Information Technology)
- EthoVision video tracking and trial control software (Noldus Information Technology, HTP 2.1.2.0)
- AHCODA analysis software (Synaptologics BV, Amsterdam, The Netherlands)
Acclimation
Mice were allowed to acclimate at least one week prior to testing.
PhenoTyper cages (description)
- Each cage contains a top unit with built in hardware for video tracking (infrared-sensitive video camera which provides constant and even illumination of the cage; an infrared filter placed in front of the camera prevents interference with room illumination, allowing continuous behavioral recordings in both dark and light periods).
- EthoVision is used as video tracking and trial control software.
- Forty-eight PhenoTyper cages are connected in a specially designed computer network. Four cages are connected to a PC running video tracking and trial control software; 12 data collection PCs are connected to a central PC (running software for experiment design and progress monitoring) and a data storage server (for storage and analysis of track files).
- The cages (30 x 30 x 35 cm; L, W, H) are made of transparent Perspex walls with an opaque Perspex floor covered with cellulose based bedding. A feeding station and water bottle are attached on adjacent walls outside of the cage.
- A shelter (10 cm high and x 9 cm diameter) is made of non-transparent material and fixed in one corner. Mice typically spend 80% of their time in the shelter (resting/sleeping).
- Two bright white LED (producing no heat) are mounted on two cage walls, shining inward through the Perspex wall into the shelter from two angles to provide an aversive light stimulus (500 lx).
- In EthoVision the shelter is defined as a 'hidden zone'.
- Video tracking is performed at a rate of 15 samples/sec.
- Raw track files are processed using AHCODA analysis software.
- For more information, see EthoVision XT 4.1 manual.
Procedure: PhenoTyper activity monitoring
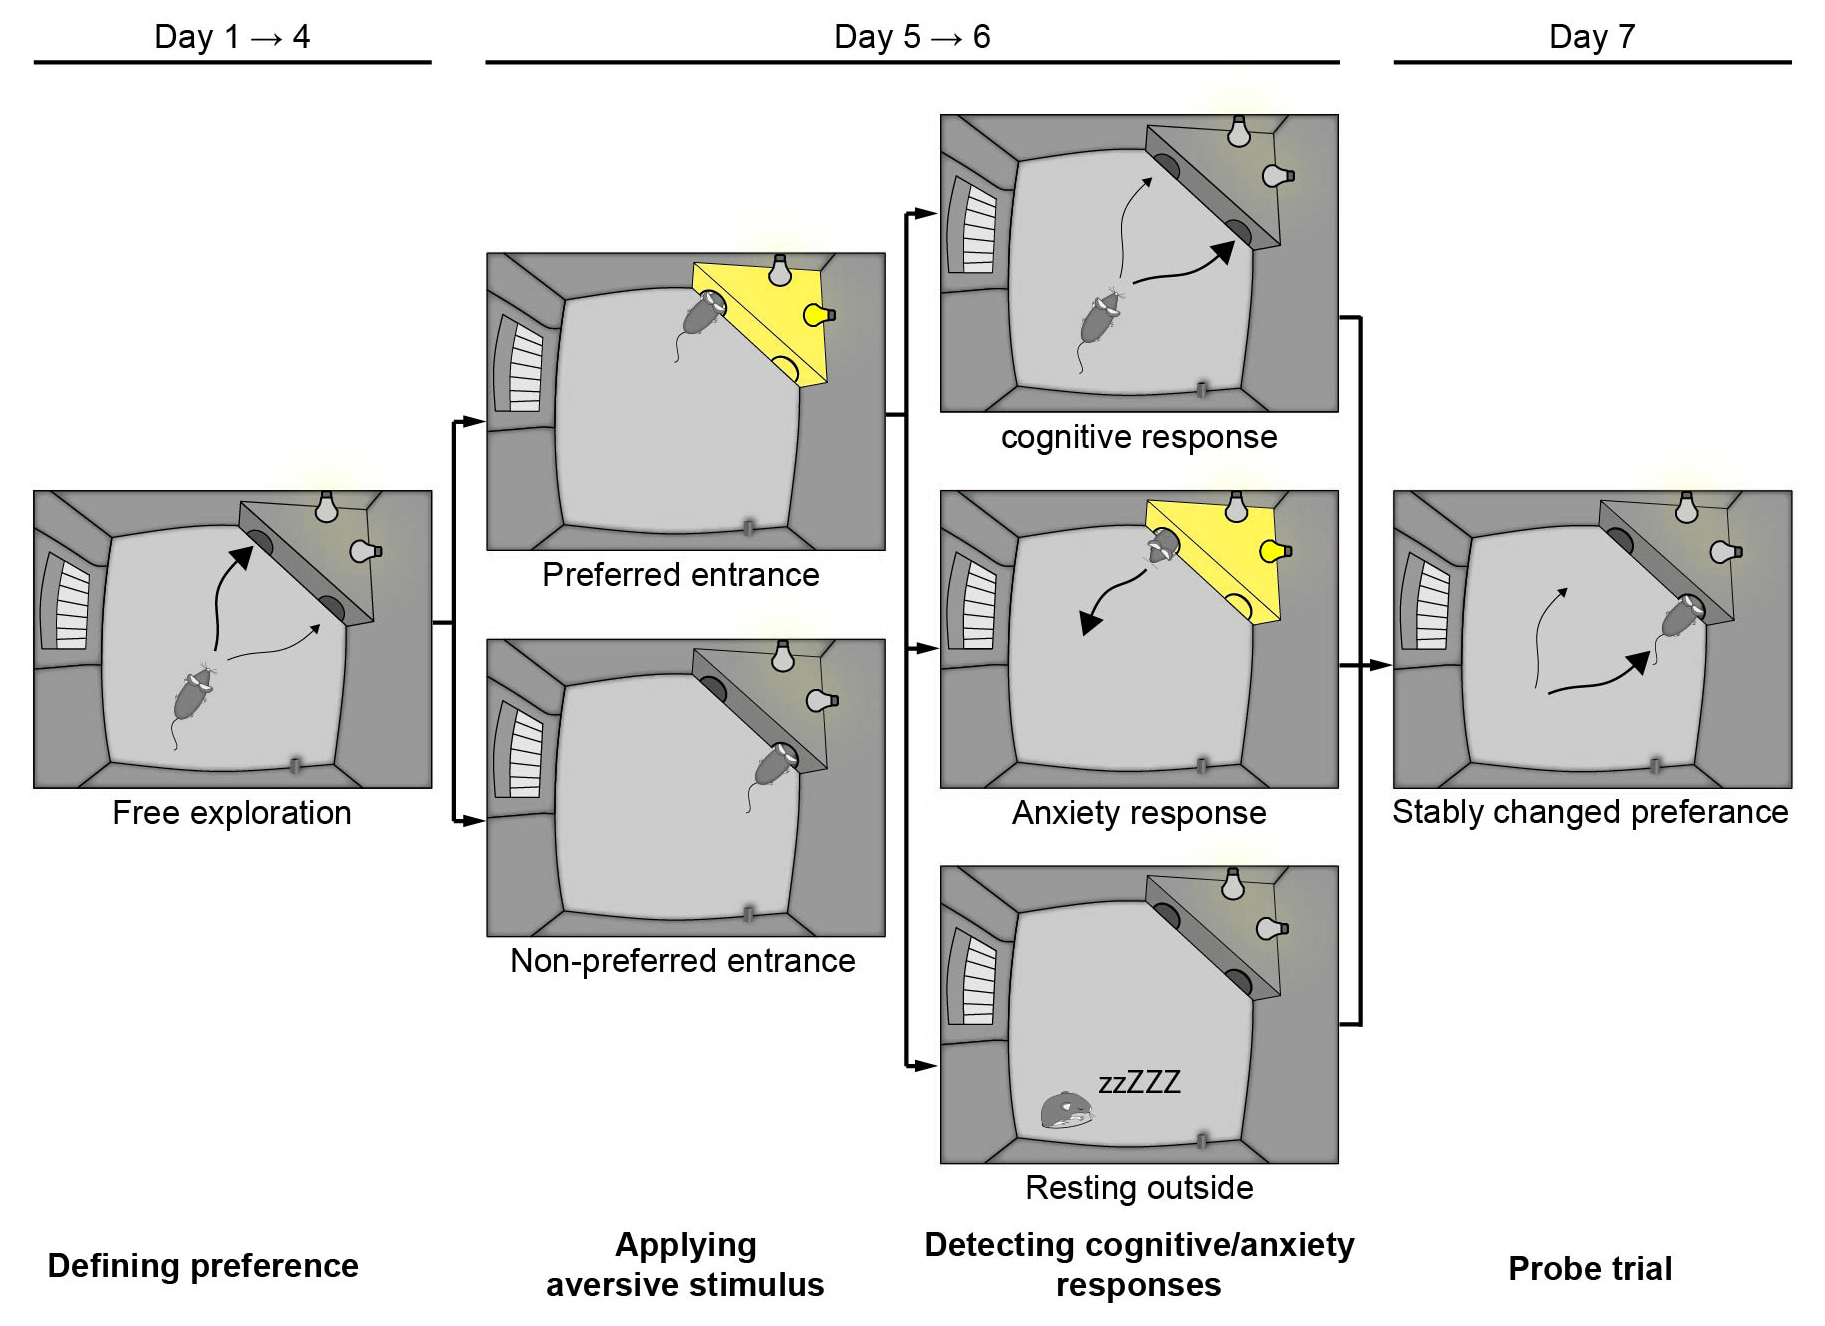
- Mice are individually housed in PhenoTyper cages for 6.5 days.
- During the first 4 days, mice can enter freely in the shelter (habituation phase, defining entrance preference).
- On day 4, the preferred entrance is defined by the system as the most used entrance (mice with no preference are excluded from analysis).
- On days 5 and 6, each time a mouse uses its preferred entrance, bright light is automatically switched on in the shelter as long as the mouse stays inside (avoidance learning phase, applying aversive stimulus).
- As soon as the mouse leaves the shelter through either entrance, the light turns off.
- The light does not turn on when the mouse enters through the non-preferred entrance.
- The shelter light flashes once when the mouse moves into a 3 cm area around the preferred entrance of the shelter area on days 5 and 6 to signal aversive learning trial (detecting cognitive/aversive response).
- On the last half day, the aversive stimulus is no longer applied (probe trial) and the stability of the change in preference is determined.
- frequency of entries in each entrance of the shelter
- distance moved
- time spent in shelter
- preference index = [(number of entries through the preferred entrance) - (number of entries through non-preferred entrance)] / (total number of entries)
- aversion index = [(time spent in illuminated shelter after entering through the sanctioned entrance) - (time spent in the dark shelter after entering through the non-sanctioned entrance)] / (total time spent in shelter)
Note that accessioned measurements for Loos1 are from days 4-7, dark cycle only. Additional data are available in a supplemental data file.
*Supplementary data are available for this project. See Loos1