Klaassen1 project protocol
Cadmium toxicity in the testes, liver, and trigeminal ganglia in males of 8 inbred strains of mice (2001)
Klaassen CDWith: Habeebu SS, Liu Y, Park JD
Project protocol — Contents
Workflow and sampling
Equipment
Reagents, supplies, and solutions
Procedures
Definitions
Data
References
Workflow
Histopathology samples are evaluated microscopically • Dissecting kit
• Packard gamma scintillation spectrometer
• Balance scale
• Microtome for tissue sectioning
• Light microscope
Reagents, supplies, solutions Â
• Cadmium chloride (CdCl2) reagent grade, Fisher Scientific Co. (Fair Lawn, NJ)
• 109CdCl2 (5.12 µCi/mg), New England Nuclear Research Products (Boston, MA)
• Needles and syringes
• Perfusion setup
• Physiological saline (0.9% NaCl)
• Pentobarbital (60 mg/kg)
• 0.4% paraformaldehyde,10% neutral formalin
• Hematoxylin and eosin (H&E)
Histopathology of cadmium toxicity
a. Treated male mice (5-4 per strain per study group) are injected with 15 µmol CdCl2/kg (20 µCi 109Cd/kg) i.v., dissolved in physiological saline (0.9% NaCl) in a volume of 10 mL/kg BW bolus, via the tail dorsal vein, while the control group is given saline vehicle.
b. After 24 hrs following CD administration, the mice are deeply anesthetized with 60 mg/kg BW dose of pentobarbital.
c. Under adequate anesthesia, the thoracic cavity is opened for total body perfusion via the heart, initially with normal saline to flush the blood, and then with freshly made 0.4% paraformaldehyde for pre-fixation.
d. The perfusion pre-fixed brains, trigeminal ganglias, liver, and testes are dissected, weighed, and Cd content determined using gamma scintillation spectrometry.
e. Following Cd content ditermination, the organs are placed in fresh 0.4% paraformaldehyde or 10% neutral formalin for 24 h.
f. Fully fixed liver, ganglia, and testes are then processed via standard histopathological techniques, sectioned at 5 µm thickness, and stained with H&E.
g. Three sections from the each entire trigeminal ganglion, liver, and testes (9 sections from each mouse) are microscopically evaluated and scored for cadmium toxicity (see Figures 1-4 below).
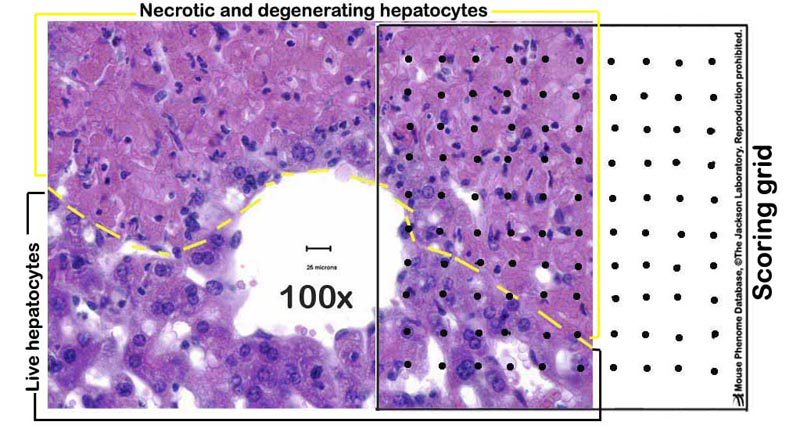
h. Liver sections are evaluated for necrosis, apoptosis, and other lesions; hepatocytes (1500â2500 per mouse) in 12â20 randomly selected fields are counted under 400X magnification, aided by a grid of 100 squares (see Figures 1-2 below).
i. Apoptotic index (AI) and mitotic index (MI) are determined by dividing the total number of hepatocytes showing apoptosis (apoptotic cells and bodies) or mitosis by the total number of cells in the fields examined. Clusters of two or three apoptotic bodies are regarded as single apoptotic events (Habeebu et al, 1998).
j . Typing of apoptotic cells and bodies (intracellular or extracellular, chromatin-containing or non-chromatin-containing) is done at 1000X magnification or 100X objective (with oil immersion).
k. Necrosis is analyzed semiquantitatively with five scores for severity: 0= none; 1= necrosis of 1â5% of hepatocytes; 2=necrosis of 6â25% of hepatocytes; 3=necrosis of 26â50% of hepatocytes; and 4=necrosis of >50% of hepatocytes.
Figure 1. A schematic example of a partially necrotic liver-partly overlayed with a scoring grid.
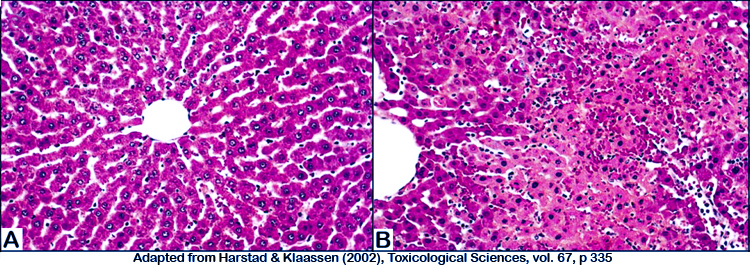
Figure 2. Photomicrograph illustrations of (A) normal untreated liver, and (B) cadmium-treated liver showing marked hepatic necrosis.
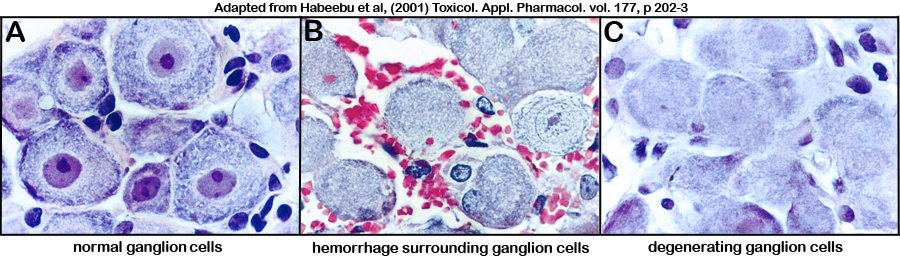
Figure 3. Photomicrograph illustrations of (A) normal untreated ganglion cells, and (B-C) cadmium-treated ganglion cells showing neurotoxicity (i.e. red blood cells surrounding ganglion cells in panel B, and pale nuclear staining or "ghost cells" in panel C).
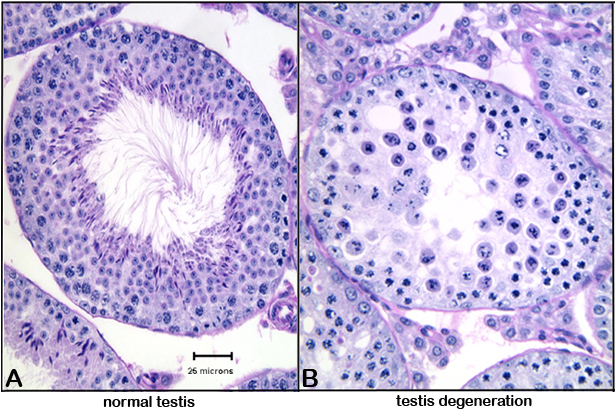
Figure 4. Photomicrograph illustrations of (A) normal testis, and (B) testis showing cellular degeneration (round cells with pyknotic or fragmenting nuclei).Data collected by investigator
Cadmium-induced toxicity to the liver, testis and trigeminal ganglia.
References
Choudhuri S, Liu WL, Berman NE, Klaassen CD. Cadmium accumulation and metallothionein expression in brain of mice at different stages of development. Toxicol Lett. 1996 Mar;84(3):127-33.
PubMed 8600611 Habeebu SS, Liu J, Klaassen CD. Cadmium-induced apoptosis in mouse liver. Toxicol Appl Pharmacol. 1998 Apr;149(2):203-9.
PubMed 9571989 Harstad EB, Klaassen CD. Analysis of strain difference in sensitivity to cadmium-induced hepatotoxicity in Fischer 344 and Sprague-Dawley rats. Toxicol Sci. 2002 Jun;67(2):329-40.
PubMed 12011493 Klaassen CD, Liu J, Diwan BA. Metallothionein protection of cadmium toxicity. Toxicol Appl Pharmacol. 2009 Aug 1;238(3):215-20. Epub 2009 Apr 9.
PubMed 19362100 FullText