Jaxpheno8 project protocol
Echocardiography and auditory brainstem response survey in males of 7 inbred strains of mice (2010)
Jackson LaboratoryWith: Denegre J, Yang Y, Nicholson A, Davis C, Ryan J, McFarland H
Project protocol — Contents
Workflow and sampling
Equipment
Reagents, supplies, and solutions
Procedure for conducting echocardiography (ECHO)
Procedure for conducting auditory brainstem response (ABR)
Data
ReferencesWorkflow
Data collected
High-frequency ultrasound High-frequency ultrasound Measurements of cardiac-left ventricular performance using echocardiography M-mode High-frequency ultrasound Sound stimulus generator and signal transducer
- Balance scale
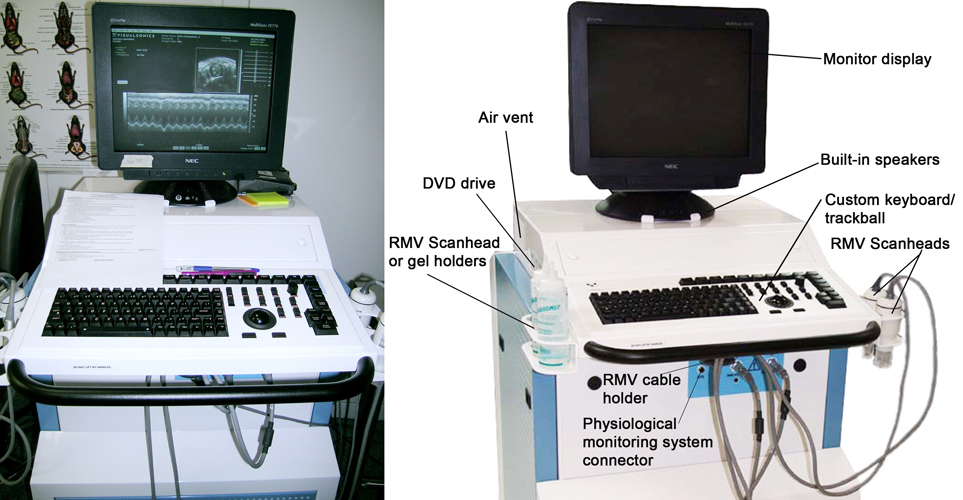
- Vevo 770 High-Frequency Ultrasound (Visualsonics, Toronto, Ontario, Canada
- Small rodent gas anesthetic delivery system
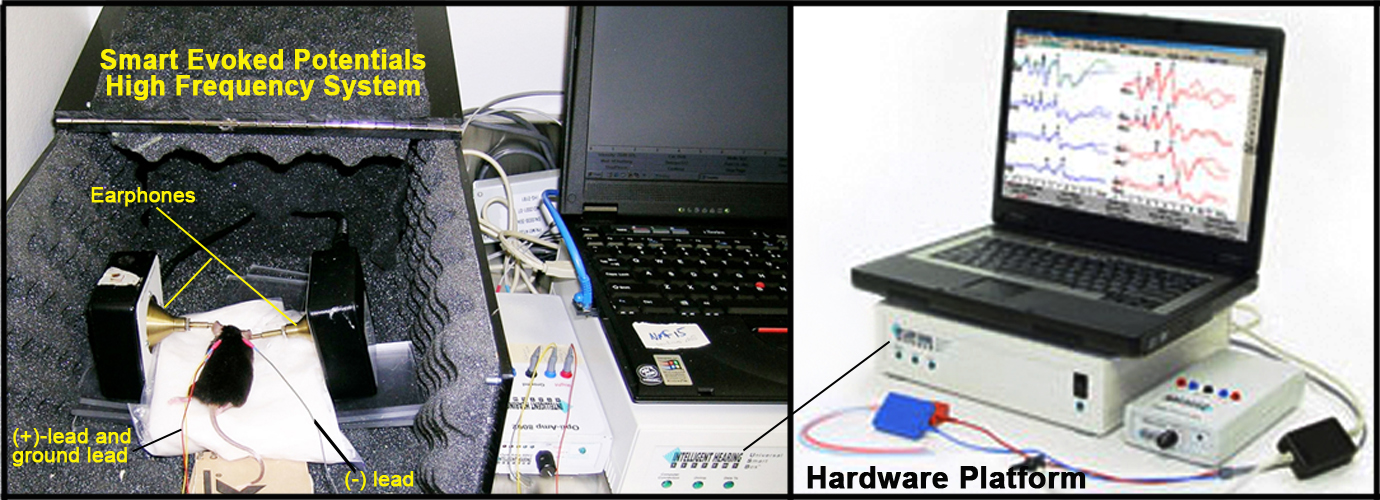
- Smart EP High Frequency System (Intelligent Hearing System, Inc. Miami FL) is used to deliver pure tones or white noise at variable
frequencies and decibels, as well as record the electrical activity of the hair cells along the auditory pathway- Rectal core body temperature probe
- Platinum sub-dermal electrodes (Astro-Med Inc Warwick, RI)
- Heating lamp and heating pad
- Isoflurane gas anesthesia
- 0.2 mL/10g body weight tribromoethanol (Avertin)
- Depilatory cream-Nair®
- Electrode gel
- Dermicell tape
- Gauze
- Artificial tears/ corneal lubricant
Procedures for conducting echocardiography (ECHO)
Mouse pre/post-echocardiography preparation
a. The Vevo 770 High-Frequency Ultrasound is used to image cardiac morphology and to extrapolate cardiac function in anesthetized mice at a spatial resolution down to 30 µm, and an image capture rate of up to 100 frames/min according to manufacturer's instructions.
b. Either a 30 or 40 MHz real-time micro-visualization (RMV) scan head is used to yield ultrasonic images with infiltration depths of 12.7 mm or 6 mm respectively.
c. Before imaging is performed, mice are induced individually with 5% isoflurane at 0.8 L/min flow rate.
d. When mouse is at a proper anesthetic depth following induction, isoflurane flow is switched from induction chamber to maintenance using a nose-cone delivering 1- 1.5% isoflurane at 0.8 L/min flow rate.
e. Artificial tears is applied over the cornea in both eyes as a lubricant to prevent corneal dehydration and opacity.
f. The mouse is positioned on a heating-pad ventro-dorsally (prone) to optimally image the heart.
g. Heart Rate monitor is turned ON and signal threshold adjusted until Heart Rate (HR) reading is consistent and stable. Signal threshold is commonly filtered at 1 Hz.
h. To obtain reproducible and stable high quality images, heart rate and body temperature are tightly regulated while the mice are under anesthesia. Heart Rate is maintained at >400 BPM; if Heart Rate drops below 400 BPM, anesthetic dept is adjusted accordingly and ensuring body temperature is maintained between 34-37°C.
i. Rectal core temperature probe is lubricated and inserted gently, and then secured to the platform with an adhesive tape.
j. Superficial hair is removed from the region of interest (ROI) with a depilatory cream (Nair®), just prior to imaging. Nair® is applied for no longer than 3 min at any one time to prevent chemical burn.
k. Depilated hair and residual Nair® is removed with a wet gauze.
l. A small amount of electrode gel is placed on each ECG electrode and mouseâs paws are taped with Dermicell tape to the electrodes.
m. An adequate amount of warm ultrasound gel is applied over the heart region or anatomical regions of interest and then imaged.
n. Mice are allowed to recover from anesthesia under a heat lamp upon completion of imaging session.Procedure for conducting auditory-evoked brainstem response (ABR)
Animal preparation and determination of auditory-evoked brainstem response (ABR) threshold to "click" stimuli
a. Hearing function is assessed using auditory-evoked brainstem response (ABR) measurements obtained by a computer-aided evoked potential system (Intelligent Hearing System (IHS), Smart EP High Frequency System) according to manufacturer's instructions.
b. The Smart-EP version 10, modified for high frequency capability and coupled to high frequency transducers is used to generate specific acoustic stimuli.
c. Before testing, mice are injected intraperitoneally with 2% Tribromoethanol at a dose of 0.2 mL/10 g body weight and placed on a heating pad set to body core temperature of 37°C.
d. Once at proper anesthetic depth, corneal lubricant (artificial tears) is applied to prevent dehydration and corneal opacity.
e. While under proper anesthetic depth, platinum electrodes are inserted subcutaneously. The negative electrode lead is inserted below the left earlobe, the positive lead is inserted on the top of the head and the ground lead is inserted between the eyes (see Figure above).
f. Speaker/microphone is placed in each ear at appropriate height level.
g. Specific acoustic stimuli are then delivered to the outer ear canal through a plastic tubing connected to funnel-speakerphone from the high frequency transducers. Filters are set to exclude signals above 3000 and below 100 Hz; amplification is at 200,000 micro volts. with an analysis time of 10 ms.
h. First sound stimulus presented consists of a white-noise click (2-8 kHz) at 70 dB, and depending on the response, is followed by increasing or decreasing volumes initially in 10 and subsequently in 5 dB steps to determine the auditory threshold; averaged responses are digitized and displayed on PC screen.
i. While mice are still fully anesthetized they are tested with a series of increasing stimulus frequencies using similar method above.Measurement of ABR threshold to increasing series of stimulus
a. Once the auditory threshold is determined with the initial sound stimulus clicks, the series is then repeated for stimulus frequencies of 8, 16 and 32 kHz and with a duration of 3 ms rise, and 1.5 ms fall time.
b. Mice that show no responses are determined to be deaf. Those with elevated thresholds (strain and age-dependent) are retested to confirm the findings.
c. Sound pressure level thresholds are determined for each stimulus frequency by identifying the lowest intensity producing a recognizable ABR pattern on the computer screen (at least two consistent characteristic wave forms).
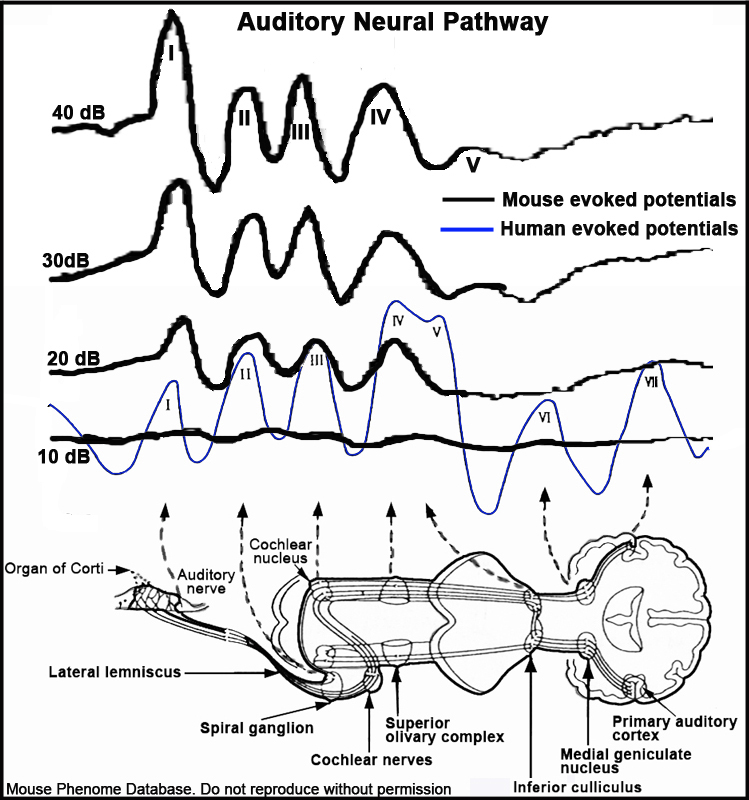
d. Auditory-evoked brainstem response in the form electrical activity originating from auditory hair cells are transmitted along the auditory neural pathway (see Figure 1 below) and displayed in characteristic wave forms that are amplified, recorded and analyzed in terms of latency of signal transmission in anesthetized mice.
e. Peak-to-peak amplitudes and wave latencies are derived using IHS software. Five peaks are produced in response to auditory stimuli in a healthy mouse, each representing a different step in the neural pathway: 1) Organ of Corti, 2) Spiral Ganglion, 3) Cochlear Nucleus, 4) Superior Olivary Complex, and 5) Inferior Colliculus (see Figure below).
f. Mice are allowed to recover from anesthesia under a heat lamp upon completion of ABR testing.
Figure 1. Schematic illustration of the auditory evoked potentials and auditory neural pathway in the mouse.
Table 1: Normal decibel ranges based on Zheng, Johnson and Erway (1999).
Definitions and calculations
Table 2. Echocardiographic views and applicable Modes.
View description Applicable Modes Apical, 2 Chamber B-Mode Apical, 3 Chamber PW Doppler Mode Apical, 4 Chamber B-Mode, PW Doppler Mode Apical, 5 Chamber B-Mode, PW Doppler Mode Insufficiency PW Doppler Mode Parasternal Short Axis PW Doppler Mode Parasternal Long Axis B-Mode, M-Mode B-MODE (brightness mode)
• The mode that is used for the display of echoes that return to the transducer.
• There is a change in spot brightness for each echo that is received by the transducer.
• The returning echoes are displayed on a television monitor as shades of gray.
• Typically the brighter gray shades represent echoes with greater intensity levels.
• This mode allows you to scan the heart in 2 dimension.Table 3. B-Mode echocardiographic measurements and formulas.
Abbreviation Formula LV Vol; d Left Ventricle Volume; Diastole [4/3]*[LV Major; d/2]*[LV Area; d/LV Major; d/2]2 LV Vol; s Left Ventricle Volume; Systole [4/3]*[LV Major; s/2]*[LV Area; s/LV Major; s/2]2 LV SV Left Ventricle Stroke Volume LV Vol; d â LV Vol; s LV %EF Left Ventricle Percent Ejection Fraction [LV SV/LV Vol; d]*100 LV CO* Left Ventricle Cardiac Output LV SV*Heart Rate LV ED; d Left Ventricle, End Diastole Linear Distance LV ED; s Left Ventricle, End Systole Linear Distance LV %FS Left Ventricle Percent Fractional Shortening 100*[1 â [LV ES; s*LV ED; d]] Vmean* Mean Velocity [StrokeDistance/[60/HR]] Ao Peak Grad Aortic Peak Gradient [1.053/2]*[Ao Vmax/100]2 PA Peak Grad Pulmonary Artery Peak Gradient [1.053/2]*[Ao Vmax/100]2 Integrated blood pressure measurement
• Left ventricular pressure signals can be transferred into the Vevo imaging system simultaneously with left ventricle view to record real-time left ventricular inner diameter (LVID).
• Two-dimensional targeted M-Mode tracings can be recorded through the walls of the left ventricle at a sweep speed of 1540 m/s.
• Left ventricular pressure waveform input and pressure derivative (dP/dt) are superimposed on the electrocardiogram (ECG) trace, heart rate (HR), left ventricular systolic pressure (LVSP), body temperature and respiratory rate, all simultaneously monitored on the Vevo imaging system.
• Pressure/volume loops can be generated within the software.M-Mode (motion mode)
• M-Mode imaging produces quantifiable images to characterize moving anatomy, such as a cardiac wall motion, by selecting a line of the B-Mode image and observing it over time.
• Sample volume size down to 50 µm; adjustments can be made with sample sizes of 2 mm, sweep speed of 1540 m/s.
• M-Mode cine loop has a maximum length of 30 s.
• Is a graphic B-mode pattern that is a single line time display that represents the motion of structures along the ultrasound beam, 1000 frames per second (fps).
• This mode allows the tracing of motion i.e. heart wall motion, vessel wall motion.Table 4. M-Mode echocardiographic measurements and formulas.
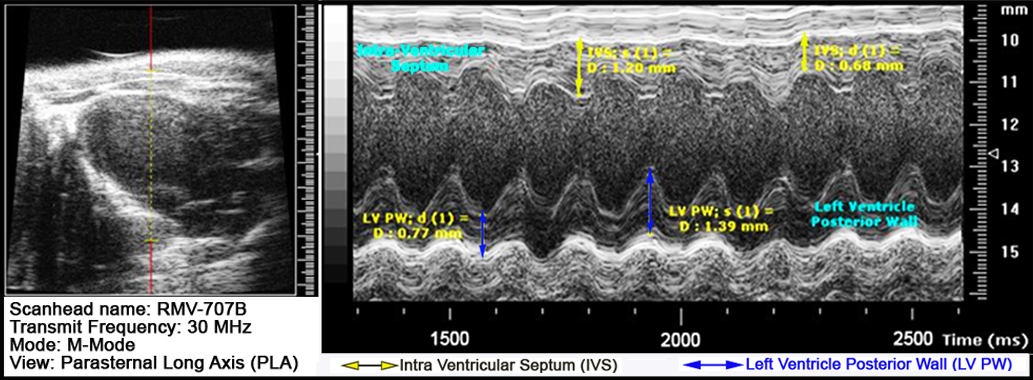
LV AW; d Left Ventricle Anterior Wall; Diastole Depth/thickness LV AW; s Left Ventricle Anterior Wall; Systole Depth/thickness IVS; d Intra Ventricular Septum; Diastole Depth/thickness IVS; s Intra Ventricular Septum; Systole Depth/thickness LVID; d Left Ventricle; Diastole Depth/thickness LVID; s Left Ventricle; Systole Depth/thickness LV PW; d Left Ventricle Posterior Wall; Diastole Depth/thickness LV PW; s Left Ventricle Posterior Wall; Systole Depth/thickness HR Heart Rate Heart Rate LV %FS Left Ventricle Percent Fractional Shortening [[LVID; dâLVID; s]/LVID; d]*100 LV Vol; d** Left Ventricle Volume; Diastole [7/2.4 + LVID; d]*LVID ; d 3*1000 LV Vol; s** Left Ventricle Volume; Systole [7/2.4 + LVID; s]*LVID ; s 3*1000 LV %EF Left Ventricle Percent Ejection Fraction [[LV Vol; dâLV Vol; s]/LV Vol; d]*100 Figure 2. Left ventricle parameters derived from ultrasonographic scanned images using the M-Mode and parasternal short axis view.
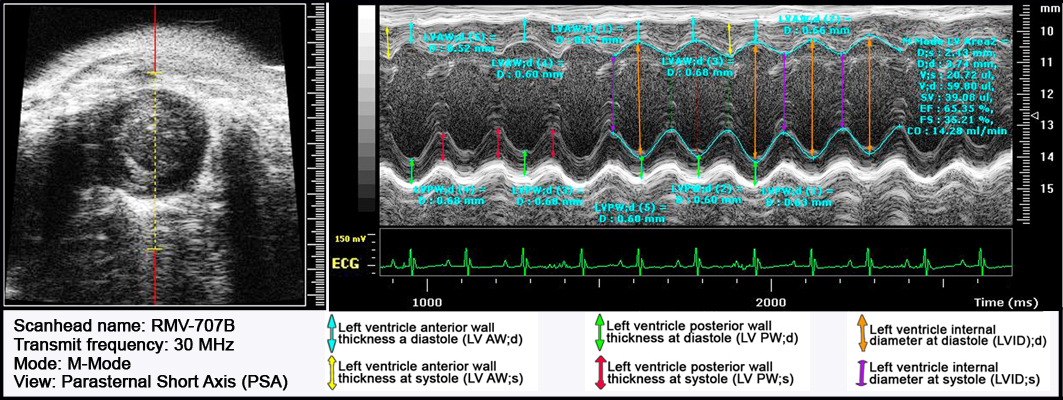
Figure 3. Left ventricle and septum parameters derived from ultrasonographic scanned images using the M-Mode and parasternal long axis view.
PW Doppler Mode
Frequency change of reflected sound waves resulting from reflection motion relative to the transducer is used to detect the velocity and direction of blood flow. This reflection shift is displayed graphically, as well as audibly. During Doppler operation the reflected sound has the same frequency as the transmitted sound if the blood is stationary. However since blood is moving away from the transducer a lower frequency is detected (negative shift) and a spectrum appears below the baseline. Conversely, if the blood is moving toward the transducer a higher frequency (positive shift) is detected and the spectrum is displayed above the baseline.
• In Pulsed-wave Doppler (PW) Mode, the Vevo transducer emits a series of pulses to detect motion. The Doppler shift that is measured is processed and then shown on screen in a spectral display.
• Sampling rate for PW range from 1-2 kHz to 125 kHz; velocities that can be detected range from a few mm/s to approximately 6 m/s.
• Sweep speed parameter can be set in within a range from 0.25 seconds at 4000 Hz to 5.1 seconds at 200 Hz.The following is the Doppler equation*:
Df = [2f v cos q]/c
Df = Doppler shift frequency (difference between transmitted and received)
f = Transmitted frequency
v = Velocity of the blood
c = Speed of sound
q = Angle of the sound beam and direction of moving blood cells
The equation can be rearranged to detect the velocity of the blood flow with the following equation:
v =[Df c]/[2 f cos q]*Careful consideration should be taken to obtain an angle of less than 60 degrees to the direction of the blood flow to obtain reliable and accurate results in quantifying the velocity in a certain blood vessel.
Table 5. Pulse Wave Doppler Mode echocardiographic measurements and formula.
HR Heart Rate A3C, A4C, A5C, PSA, Ins MV E Mitral Valve Peak E Velocity A3C, A4C, A5C MV A Mitral Valve Peak E Velocity A3C, A4C, A5C TV E Tricuspid Valve Peak E Velocity A3C, A4C, A5C TV A Tricuspid Valve Peak A Velocity A3C, A4C, A5C Ao VTI Aortic Velocity Time Integral A5C, PSA Ao Vmax Aortic Maximum Velocity A3C, A4C, A5C PA VTI Pulmonary Artery Velocity Time Integral A5C, PSA PA Vmax Pulmonary Artery Maximum Velocity A4C, A5C, PSA Figure 4. Functional assessments of ventricular valves derived from ultrasonographic scanned images of blood inflow using Pulse Wave Doppler-Mode and all chambers views.
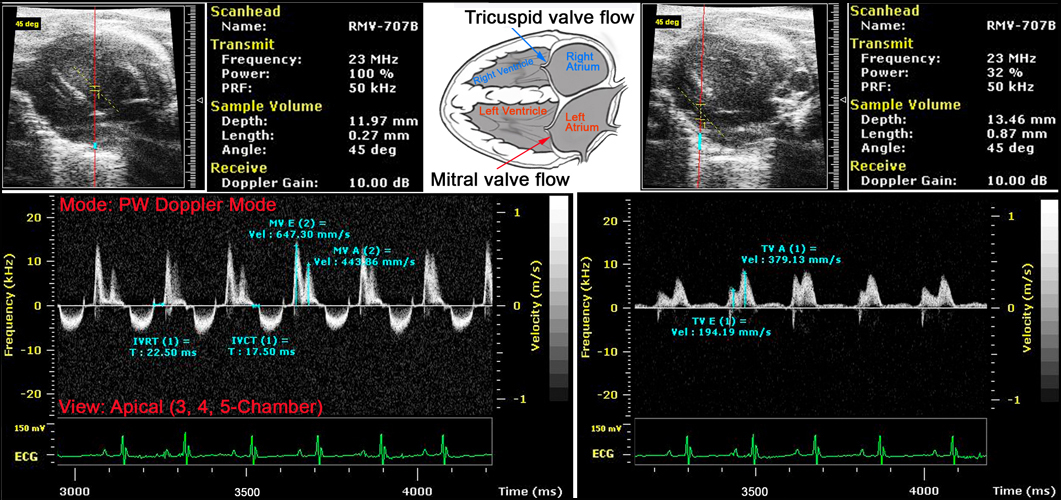
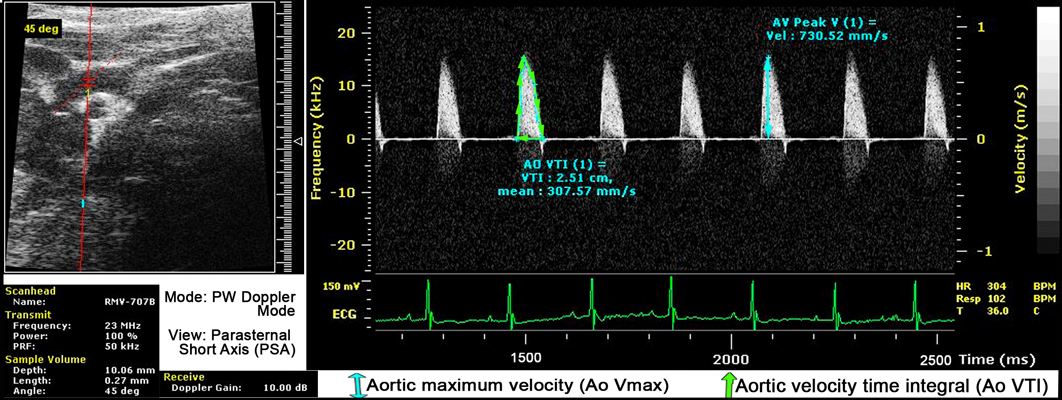
Figure 5. Functional assessments of aortic valve via ultrasonographic scanned images of outflow blood using Pulse Wave Doppler-Mode and all chambers parasternal short axis views.
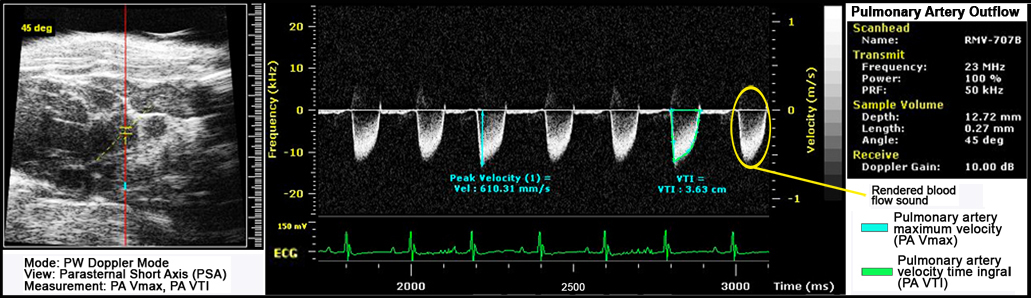
Figure 6. Functional assessments of pulmonary artery valve via ultrasonographic scanned images of outflow blood using Pulse Wave Doppler-Mode and all chambers parasternal short axis views.
Data collected by investigator
Morphological measurements using echocardiography M-mode:
• interventricular septum thickness at diastole and systole
• left ventricle anterior wall thickness at diastole and systole
• left ventricle posterior wall thickness at diastole and systole
• left ventricle internal dimension at diastole and systole
• left ventricle volume at diastole and systole
Measurement of blood flow characteristics using echocardiography pulse wave (PW) doppler mode:
• aortic valve outflow mean peak pressure gradients and peak pressure gradient
• aortic valve outflow velocity, mean velocity, and peak velocity
• aortic valve outflow velocity time integral, doppler suprasternal view
• mitral valve outflow characteristics at peak A-wave and peak E-wave
• tricuspid valve outflow characteristics at peak A-wave and peak E-wave
• pulmonary valve outflow velocity, mean velocity, and peak velocity
• pulmonary valve outflow mean peak pressure gradient and peak pressure gradient
• pulmonary valve outflow velocity time integral, doppler parasternal view
• heart rate measurement using echocardiography M-Mode parasternal short axis
Measurements of cardiac-left ventricular performance:
• cardiac output
• ejection fraction
• fractional shortening
• stroke volume
Measurement of auditory brainstem response (ABR) threshold, sound pressure level using click, 8 kHz, 16 kHz, and 32 kHz tones stimulus [dB]
References
Zheng QY, Johnson KR, Erway LC. Assessment of hearing in 80 inbred strains of mice by ABR threshold analyses. Hear Res. 1999 Apr;130(1-2):94-107.
PubMed 10320101