Jarvis1: Mapping the epistatic network through F10 generation of an advanced intercross line between SM/J and LG/J (2011)
Jarvis JP, Cheverud JM. Mapping the epistatic network underlying murine reproductive fatpad variation.
Genetics. 2011 Feb;187(2):597-610. Epub 2010 Nov 29.
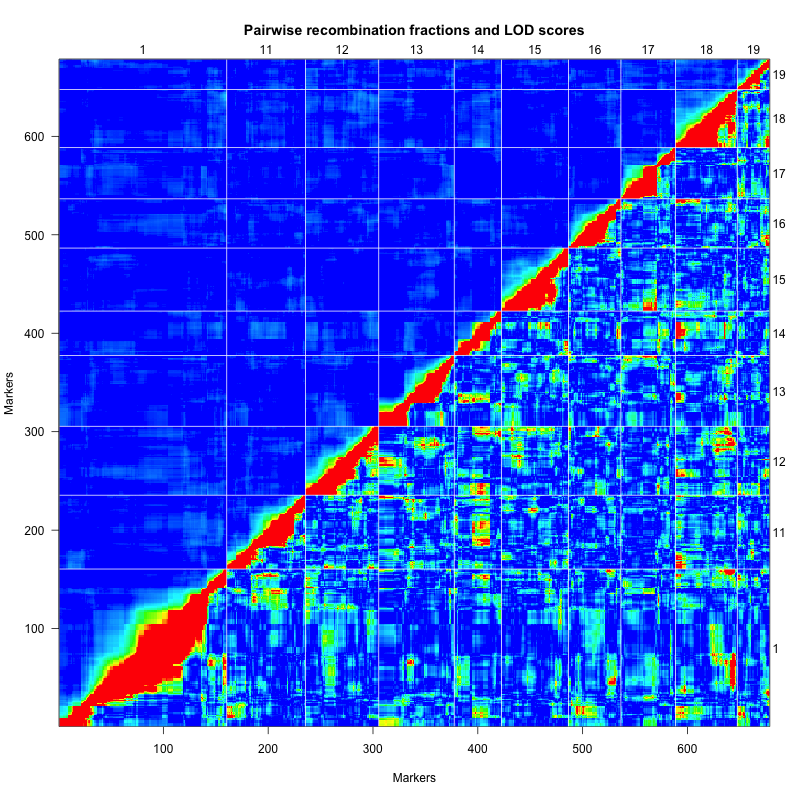
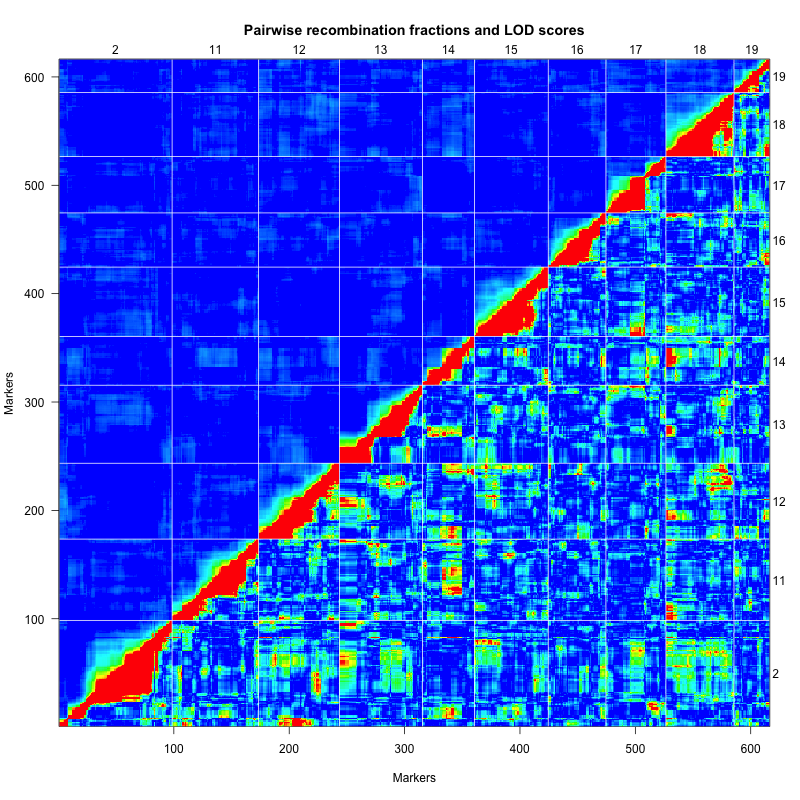
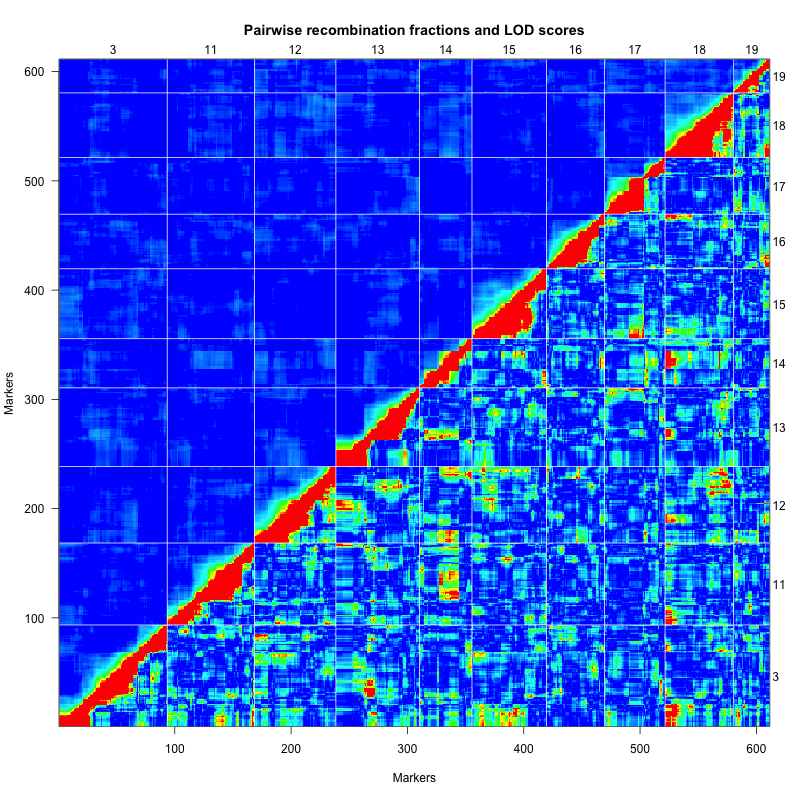
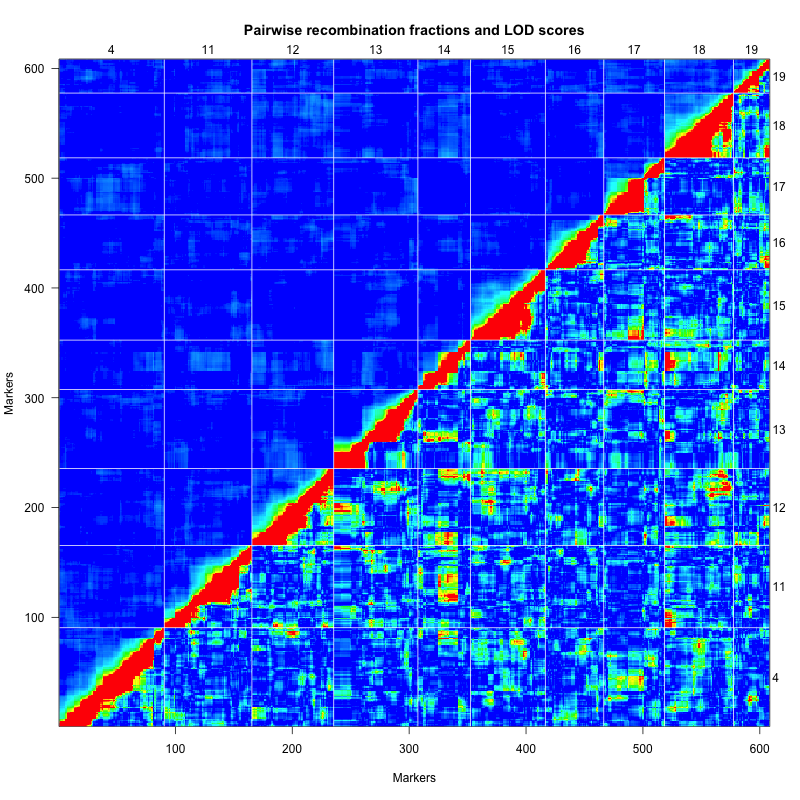
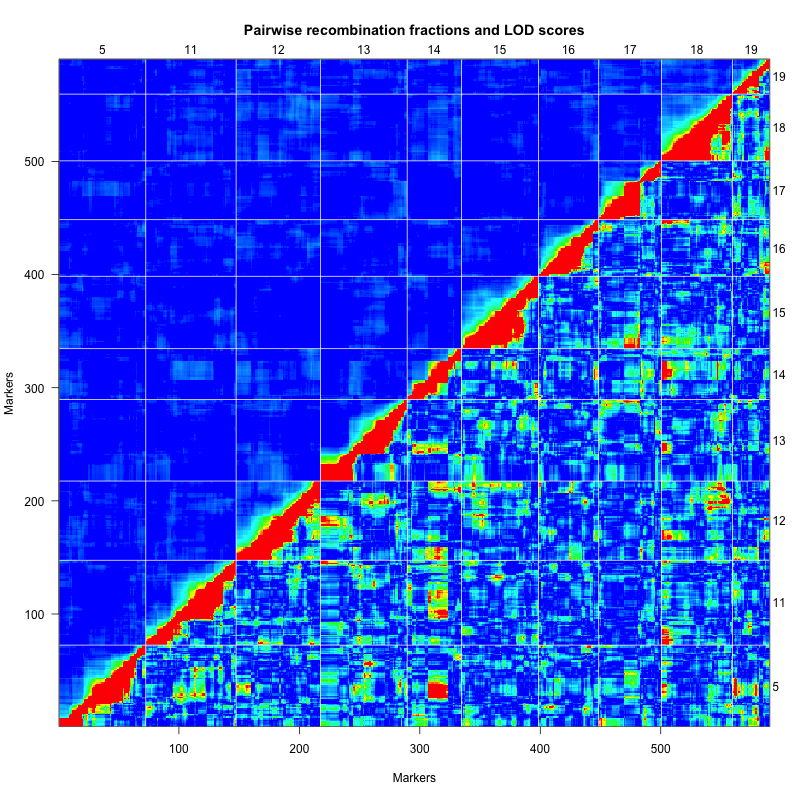
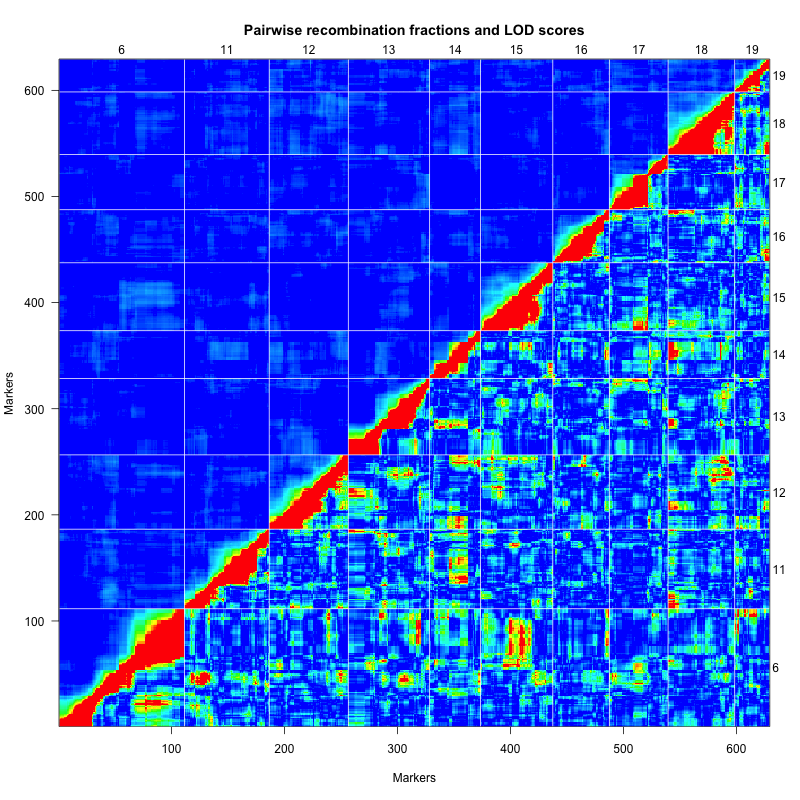
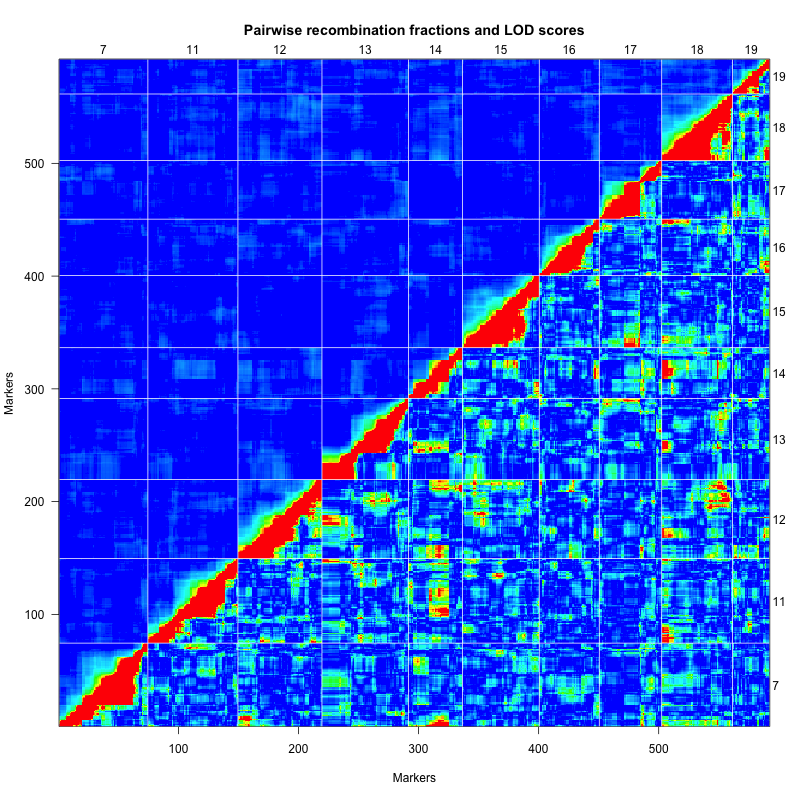
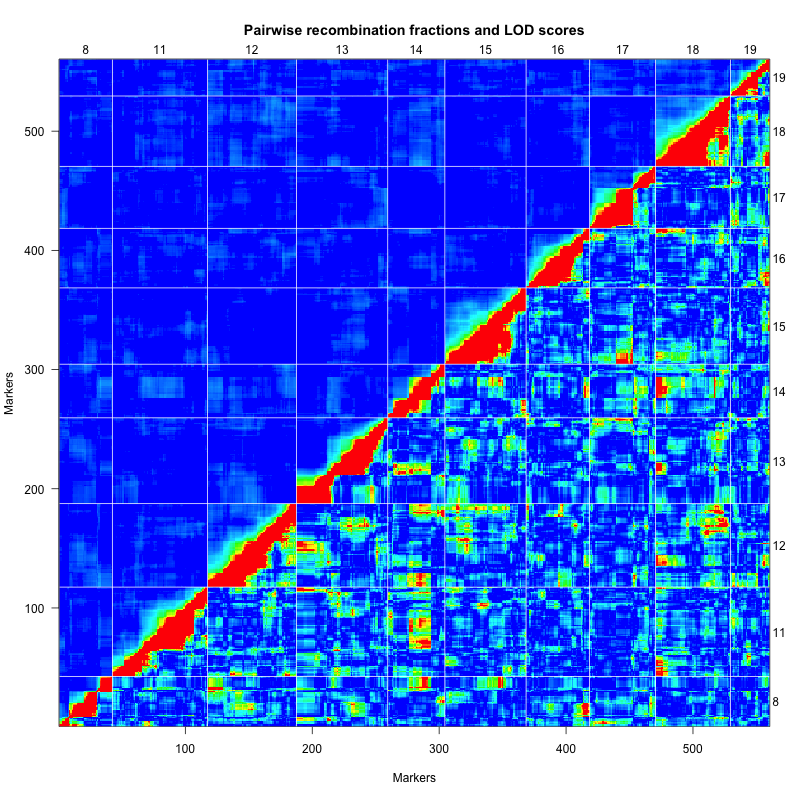
To study genome-wide epistatic interactions and their contribution to complex trait variation, the authors investigated the reproductive fat pad weight in mice using the F10 generation of the LG, SM advanced intercross (AI) line. 1304 mice (660F+644M) were tested in experiment and multiple mapping techniques were applied in this research. The results provided important information about genetic architectures. For detailed protocols see Jarvis et al 2011.
Note on studied population: SM/J x LG/J advanced intercross
Procedures conducted:
Note on studied population: SM/J x LG/J advanced intercross
Procedures conducted:
| Fat pad weight. Epistatic interactions. |
Jarvis1 downloads
QTL projects have several available downloads.
Use the QTL Data Downloads button near the bottom of this page.
QTL projects have several available downloads.
Use the QTL Data Downloads button near the bottom of this page.
Ontology terms mapped to Jarvis1 measures:
| Investigators |
J P Jarvis James M Cheverud Washington University School of Medicine, St. Louis, MO |
| Contact | James M Cheverud cheverud@pcg.wustl.edu |
| Affiliated Center | QTL Archive |
| Acknowledgements | This work was supported by a grant from the National Institutes of Health (DK-055736) and a doctoral dissertation improvement grant from the National Science Foundation (DEB-0608352). |
| QTL Archive data set | |
| MPD identifiers | Jarvis1 MPD:253 |
| No updates/corrections. Initial release date: 04/2011. |

Project / data set: Jarvis1 a.k.a. Jarvis_2011
Excel file: Data_Description_SMxLG_Jarvis2011.xlsx
CSV file: Jarvis2011_SMxLG_B37_Data.csv
Readme / text file: readme_Jarvis2011.txt
QC plots, figures, etc.: MapComparison.png
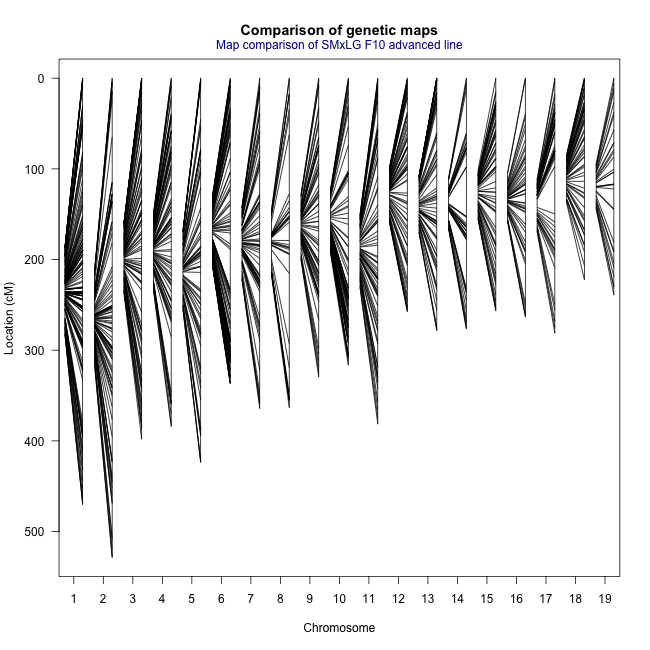
QC plots, figures, etc.: MarkerPlots.png
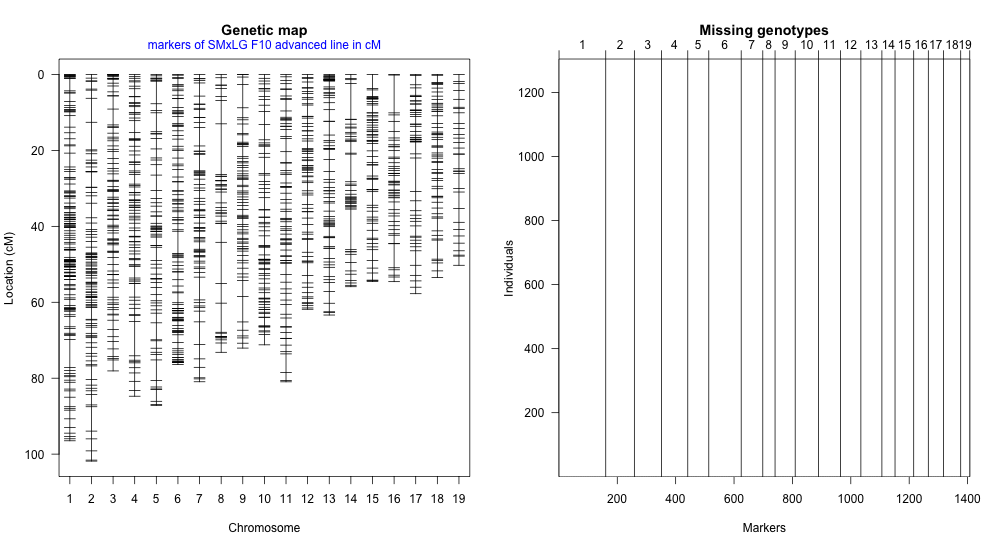
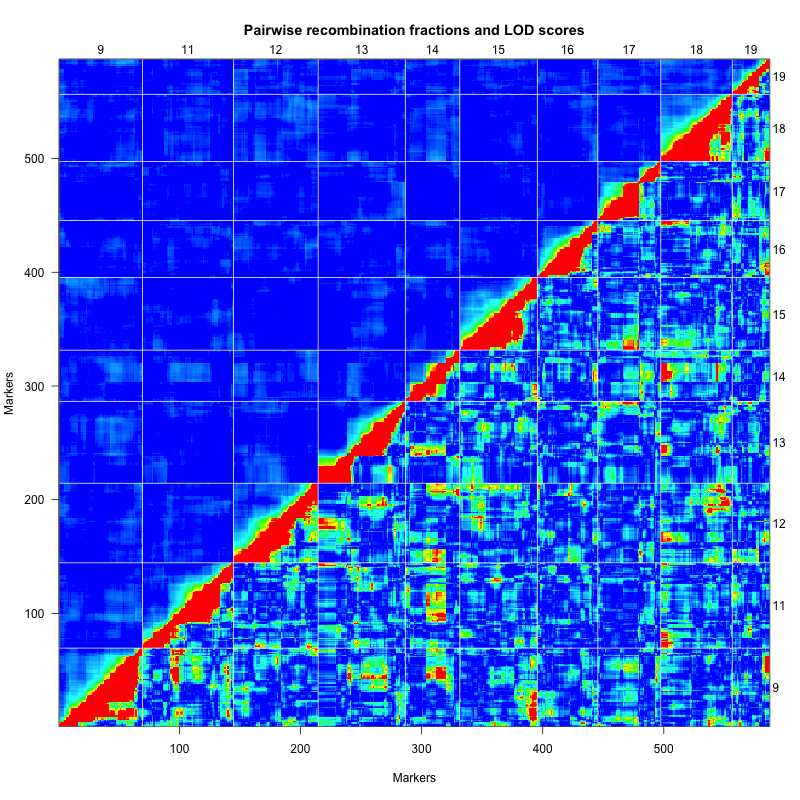
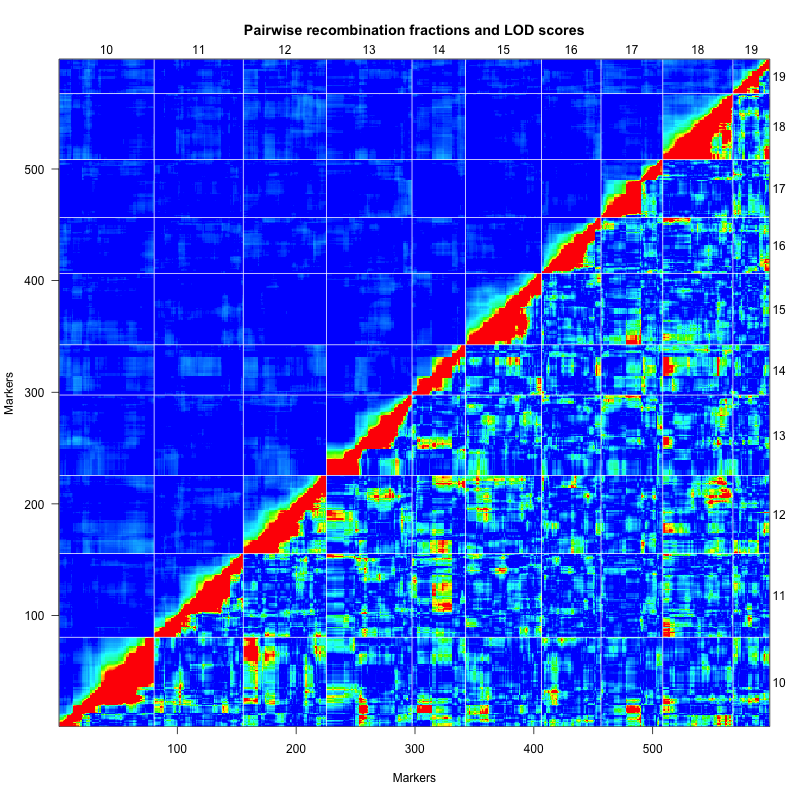
QC plots, figures, etc.: RFplot.png
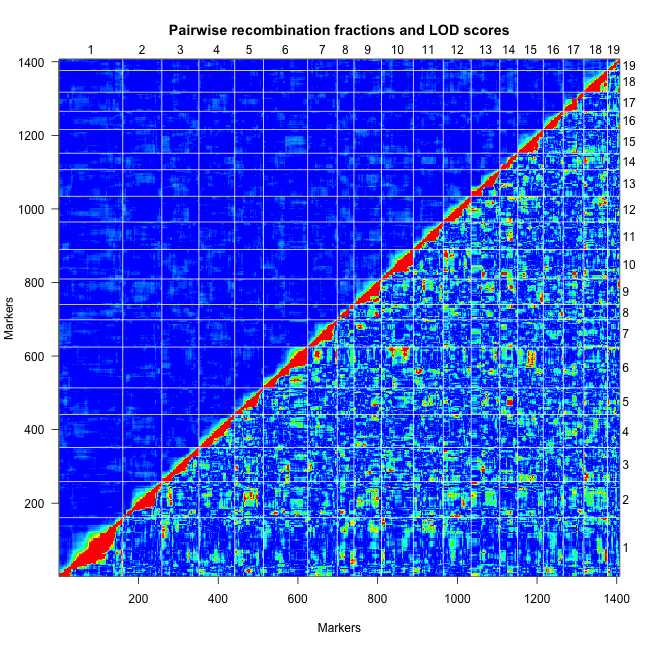
QC plots, figures, etc.: chrRFplot001_Jarvis2011.png
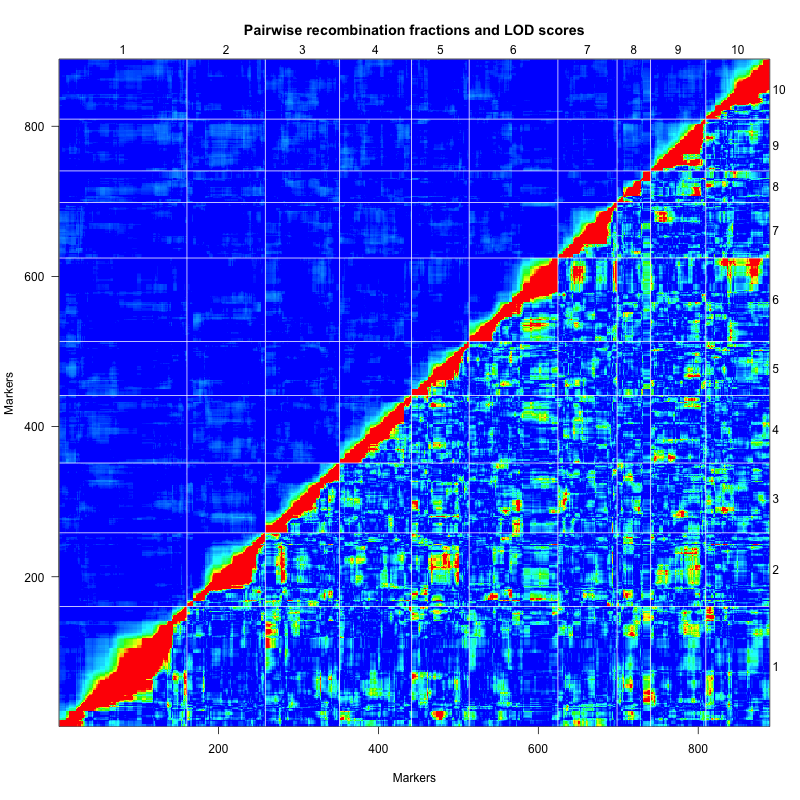
QC plots, figures, etc.: chrRFplot002_Jarvis2011.png
QC plots, figures, etc.: chrRFplot003_Jarvis2011.png
QC plots, figures, etc.: chrRFplot004_Jarvis2011.png
QC plots, figures, etc.: chrRFplot005_Jarvis2011.png
QC plots, figures, etc.: chrRFplot006_Jarvis2011.png
QC plots, figures, etc.: chrRFplot007_Jarvis2011.png
QC plots, figures, etc.: chrRFplot008_Jarvis2011.png
QC plots, figures, etc.: chrRFplot009_Jarvis2011.png
QC plots, figures, etc.: chrRFplot010_Jarvis2011.png
QC plots, figures, etc.: chrRFplot011_Jarvis2011.png