Donahue5 project protocol
Peripheral blood leukocytes in C57BL/6J-Chr#A/J/NaJ mouse chromosome substitution strains (2011)
Donahue LWith: Morgan J
Project protocol — Contents
Workflow and sampling
Equipment and supplies
Reagents and solutions
Procedure for measuring peripheral blood leukocytes using FACS
Data
ReferencesWorkflow
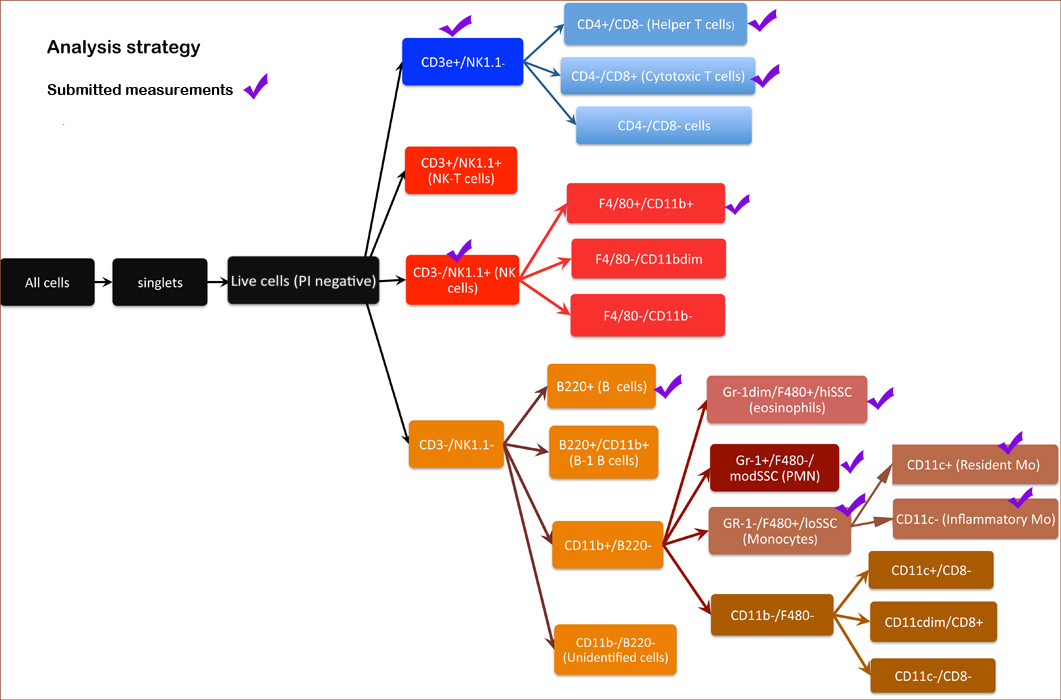
Body weight measurement Blood collected, processed for staining and kept at 4°C (for <3 h) until testing Peripheral blood cells are stained and counted (Fig. 1)
Neutrophils (granulocytes) CD11b+, F4/80 low, SSC mid Eosinophils CD11b+, F4/80+/SSC High Inflammatory monocytes CD11b+, CD11c-, Gr-1+, SSC low Resident monocytes CD11b+, CD11c+, Gr-1-, SSC low B cells CD45R(B220)+ NK Cells NK1.1+ T Cells CD3e+ Helper T cells CD3e+, CD4+ Cytotoxic T cells CD3e+, CD8+
Figure 1. Schematic layout of analysis strategy for counting cells.
- Analytical balance: Mettler-Toledo, Model AL54 (Mettler-Toledo, Inc., Columbus, OH) Â
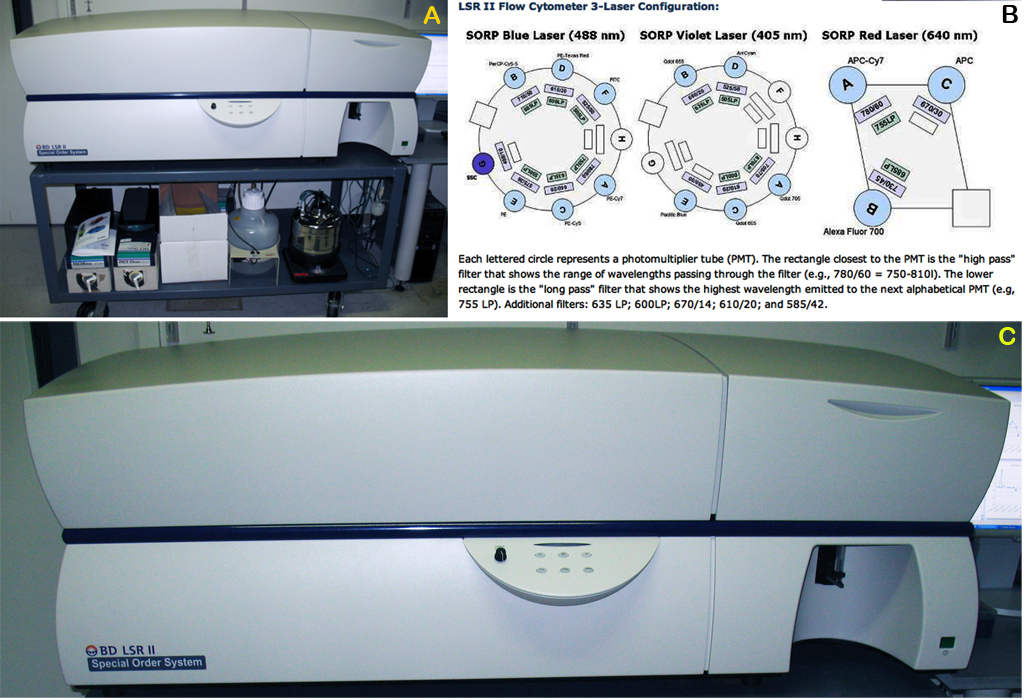
- Flow cytometer, Beckton Dickinson (BD) LSR II (BD Biosciences, San Jose, CA) Fig. 1
- Micro-capillary (hematocrit) tubes
- 12 x 75 mm polypropylene tubes (USA Scientific 1450-0000FC) or polystyrene (BD Biosciences 352008) tubes
- Parafilm© all-purpose laboratory film (Alcan Packaging, Neenah, WI) Â
- 200 µL and 1000 µL pipette tips (USA Scientific, Ocala, FL) Â
- Eppendorf® tubes  12 x 75 mm sample tubes (USA Scientific, Ocala, FL) Â
Figure 2. Beckton Dickinson (BD) LSR II system. Panel A: Becton Dickinson LSR II setup. Panel B: LSR flow cytometer 3-laser configuration. Panel C: BD LSR II closer view
- Tetracaine topical anesthetic
- 0.9% PBS (phosphate buffered saline solution)
- Hemolytic Geys buffer (J Exp Med. 1974 Oct 1;140(4):904-20)Â
- FACS Buffer (PBS with 2 mM EDTA, 0.02% NaN3, and 2% FBS) Â
- Propidium iodide 20 µg/mL solution for dead cell exclusion
- Antibody cocktail for B cells and myeloid cells:
CD45R/B220 APC clone RA3-6B2
Gr-1 APC-Cy7 clone RB6-8C5
CD11c FITC clone N418
CD11b/Mac-1 PE clone M1/70- Antibody cocktail for T cells
CD3e APC-Cy7 clone 145-2C11
CD4 Cy3 clone GK1.5
CD8 PE clone 53-6.7
CD44 APC clone IM7.8.1
CD62L FITC clone MEL-14- Antibody cocktail for NK cells
NKG2A/C/E FITC clone 20d5
NK1.1 PE clone PK136
Lgl-1 APC clone 4D11
CD3e APC-Cy7 clone 145-2C11- Antibodies are purchased from e-Biosciences (San Diego, CA) or PharMingen (San Diego, CA).
Antibody Cocktail Fluorochrome Antigen Synonym Clone FITC CD161 NK1.1 PK136 PE F4/80 F4/80 BM8 PE-Cy5 CD8a 53-6.72 PE-Cy7 CD11b Mac-1 M1/70 APC CD11c N418 AlexaFluor 700 CD4 RM4-5 APC-Cy7 CD3e 145-2C11 Pacific Blue CD45R B220 RA3-6B2 Pacific Orange Gr-1 Ly6G/C RB6-8C5 Acclimation to test conditions
In general all mice are brought into the procedure room and are bled within 1 h.
Procedure for measuring peripheral blood leukocytes using FACS
I. Peripheral blood collection
a. Mice are weighed on a scale to obtain body weight.
b. Peripheral blood is obtained by retro-orbital bleed after administering Tetracaine to the eye as a topical anesthetic (volume ~200 µL)II. Whole blood preparation for flow cytometry
a. Blood samples are centrifuged at 14,000 rpm for 5 min at 4°C to separate cells from plasma.
b. The top plasma layer is removed and stored at -80°C freezer for subsequent assay (Donahue9). The cell pellet is re-suspended in 200 µL FACS buffer and transferred to 12 x 75 mm polypropylene tubes.
c. 3 mL hemolytic Geys solution is added to each tube, incubated for 5 min at room temperature, and then centrifuged at 500 x g for 5 min to separate the hemolyzed red blood cells.
d. The hemolyzed red cell and buffer layer is decanted, the pelleted cells are re-suspend in additional 3 mL of Geys buffer, incubated for 3-5 min at room temperature, and then centrifuged again at 500 x g.
e. The wash buffer is decanted and the pelleted cells are re-suspend in 4 mL FACS buffer and then aliquoted into 3 new tubes and centrifuged at 500 x g for 5 min.
f. The supernatant layer is decanted and each tube of pelleted cells is re-suspend in 100 µL of FACS buffer and then subjected to staining with appropriate fluorescent-labeled antibodies.III. Peripheral blood staining
a. 10 µL of antibody cocktail is added at the proper dilution to each sample*. The sample is mixed well and then incubated on ice for 30 min allowing the cells to stain.
b. The stained cells are washed by adding 2.0 mL of FACS buffer to each tube and then centrifuged at 500 x g for 5 min at 4°C.
c. The supernatant is decanted and the pelleted cells is re-suspended in 250 µL of FACS buffer.
d. For dead cell exclusion, 10 µL of propidium iodide is added using 20 µg/mL stock solution.
e. FACS analysis is performed using a flow cytometer.
* All antibodies are titrated to determine optimal staining levels with minimum background staining.IV. Peripheral blood cell counts acquisition
Samples are acquired on a BD LSR II (with Cytek 5 color upgrade) cytometer (see Fig. 2) and at least 50,000 live events are collected according to manufacturerâs protocol.
Cautionary Note: The specified monoclonal antibody clones used in this study have not been tested on all strains. It is possible the antibodies do not recognize all isotypes of the marker. Thus low cell numbers for a population might not be a good reflection of the actual count.
V. Analysis of peripheral blood cell counts
a. Acquired cell count files are analyzed with FlowJo software (TreeStar, Inc., Ashland, OR).
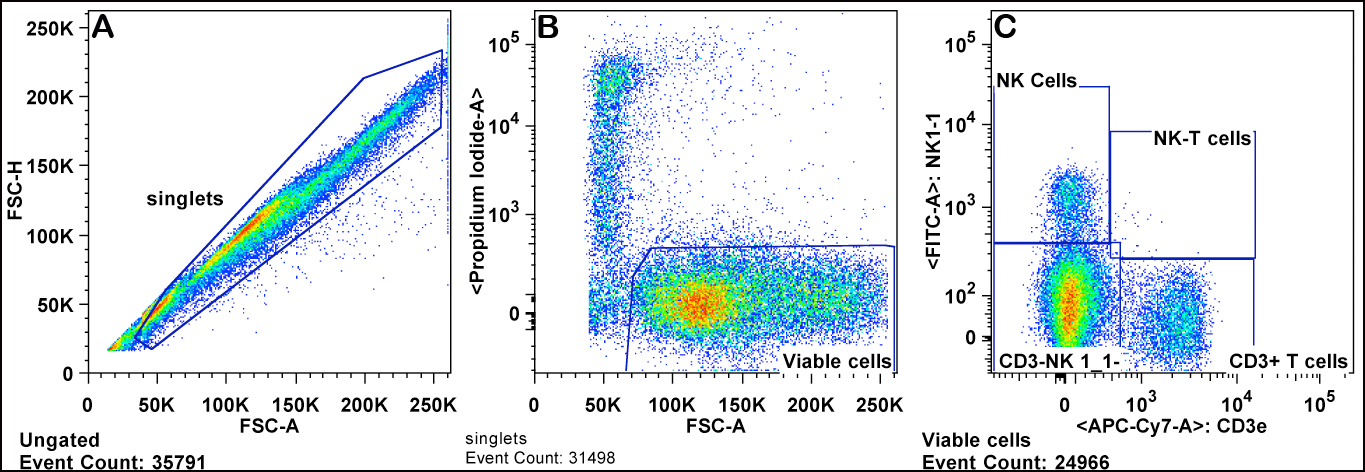
b. Viable cells are gated by forward scatter channel (FSC) and exclusion of propidium iodide. Red blood cells are also excluded as they have lower FSC than lymphocytes (Panels A & B).
c. Lymphocytes are gated from the viable cells by FSC versus SSC (sides scatter channel) for T cells, B cells, and NK cells (Panel C).
d. B cells are gated from the lymphocytes as positive for the CD45R/B220 antigen (B220+ cells) (Panel C).
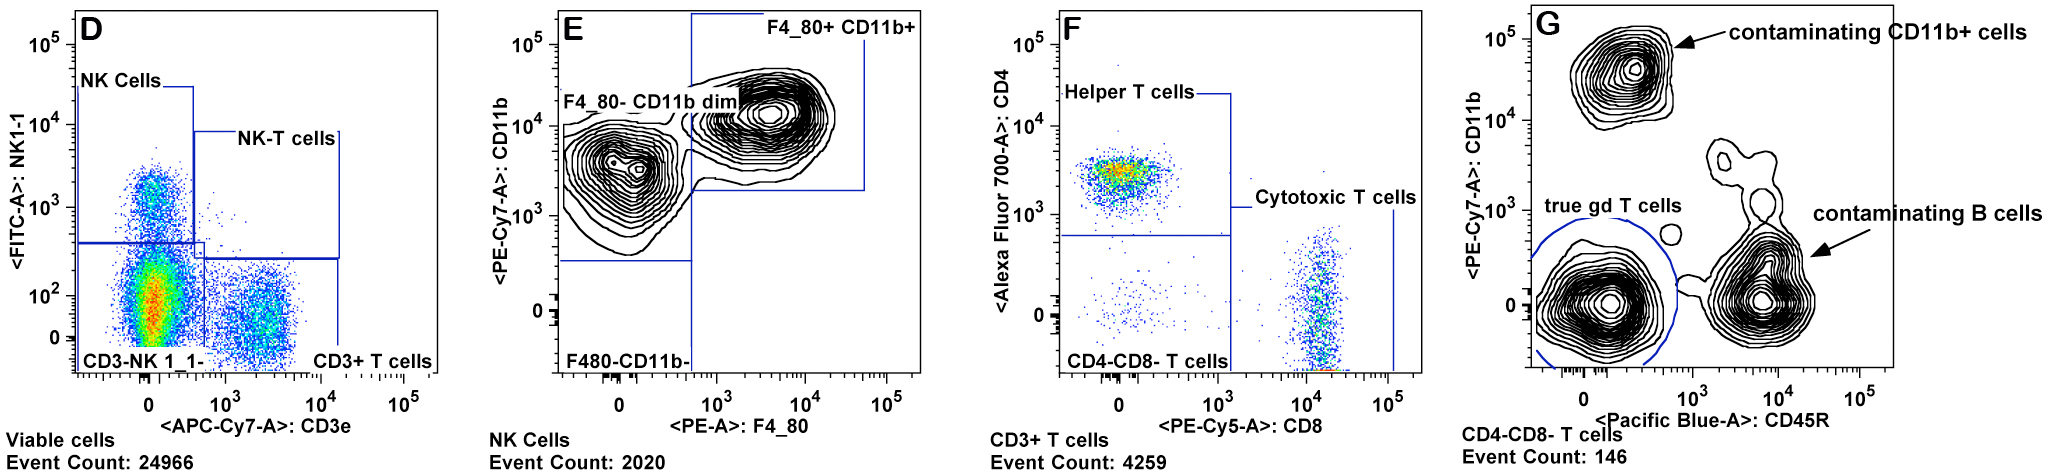
e. T cells are gated from the lymphocyte gate on the basis of CD3 and CD4 expression for CD4+ T cells ("T helper"), and CD3 and CD8 expression for CD8+ T cells ("cytotoxic") (Panels D-F).
f. CD4+ and CD8+ T cell subsets are gated for CD44 and CD62L. The memory and naive cells are defined as: CD44 high, CD62L low (effector memory), CD44 high, CD62L high (central memory), CD44 low, CD62L low, and CD44 low, CD62L high (naive) (Panel F)
g. NK cells are reported as CD3â cells divided into 3 subgroups: Lgl-1+, NK1.1+, and NKG2A/C/E+ (Panels H-J). Total NK cells are cells which fall in any of those three gates.
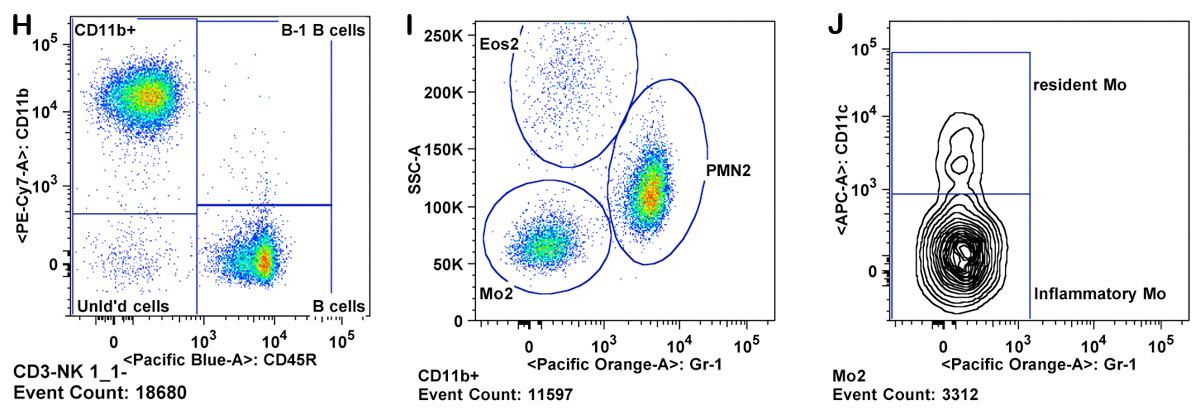
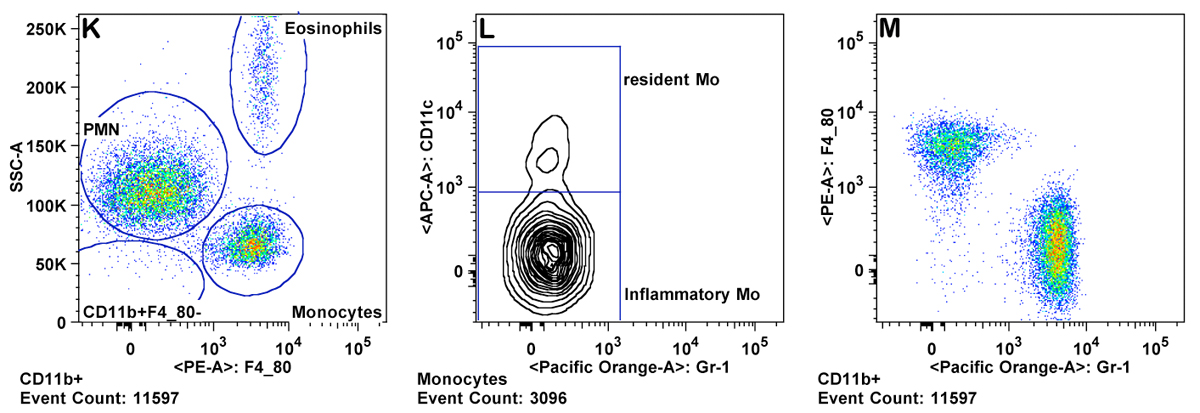
h. Granulocytes are gated as CD11b+ Gr-1 high and SSC high (Panel K ). Eosinophils are gated as Gr-1 mid to low, SSC very high, and CD11b mid to high (Panel M).
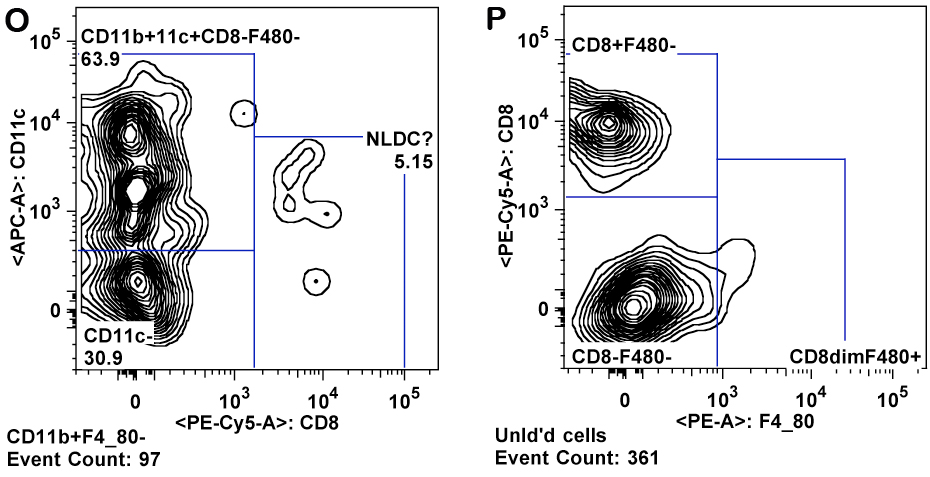
i. Monocytes are gated as CD11b+ and SSC low (as compared to granulocytes). Inflammatory monocytes are gated as CD11b+CD11câGr-1 mid. Resident monocytes are gated as CD11b+, CD11c+, Gr-1â cells (Panels L-P).
Note: The percentage of each population of viable cells is reported. The percent of viable cells of total is not the same as % cell viability, as the total includes red cells and debris in addition to dead cells.
Data collected by investigator
- neutrophil differential (percent of viable WBC)
- eosinophil differential (percent of viable WBC)
- monocyte differential (percent of viable WBC)
- inflammatory monocytes (percent of viable WBC)
- resident monocytes (percent of viable WBC)
- B cells (percent of viable WBC)
- natural killer (NK) cells
- total
- mature
- T cells
- total
- CD4 T cells (helper T cells)
- CD8 T cells (cytotoxic T cells)