Chesler6: Quantitative trait loci for sensitivity to ethanol intoxication in a C57BL/6J x 129S1/SvImJ inbred mouse cross (2012)
Chesler EJ, Plitt A, Fisher D, Hurd B, Lederle L, Bubier JA, Kiselycznyk C, Holmes A. Quantitative trait loci for sensitivity to ethanol intoxication in a C57BL/6J × 129S1/SvImJ inbred mouse cross.
Mamm Genome. 2012 Jun;23(5-6):305-2Epub 2012 Feb 28.
Individual variation in sensitivity to acute ethanol (EtOH) challenge is associated with alcohol drinking and abuse. Inbred strain C57BL/6J (B6) and 129S1/SvImJ (S1) showed different responses on certain measures of acute EtOH intoxication. To gain insight into genetic factors contributing to these differences, a QTL analysis of EtOH traits was performed in B6x129S1 F2 population. The result revealed several additive and interacting loci, and the QTLs for different EtOH phenotypes were largely non-overlapping. For detailed protocols, see Chesler et al 2012.
Note on studied population: C57BL/6J x 129S1/SvImJ
Procedures conducted:
Note on studied population: C57BL/6J x 129S1/SvImJ
Procedures conducted:
| Sensitivity to ethanol. Baseline and ethanol. |
Chesler6 downloads
QTL projects have several available downloads.
Use the QTL Data Downloads button near the bottom of this page.
QTL projects have several available downloads.
Use the QTL Data Downloads button near the bottom of this page.
Ontology terms mapped to Chesler6 measures:
| Investigators |
Elissa J Chesler The Jackson Laboratory, Bar Harbor, ME |
| Participants | Plitt A, Fisher D, Hurd B, Lederle L, Bubier JA, Kiselycznyk C, Holmes A |
| Contact | Elissa J Chesler elissa.chesler@jax.org |
| Affiliated Center | QTL Archive |
| Acknowledgements | Research supported by the National Institute of Alcohol Abuse and Alcoholism Intramural Research Program (Z01 AA000411). EJC is supported by The Jackson Laboratory and R01 AA18776. |
| QTL Archive data set | |
| MPD identifiers | Chesler6 MPD:271 |
| No updates/corrections. Initial release date: 03/2012. |
QTL data set parameters:
| Progenitor strains | 129S1/SvImJ C57BL/6J |
| Cross type | F2 reciprocal intercross |
| Population size | 178 ♀ 195 ♂ |
| Notes | one mouse was missing sex infomation |
| Age | 9-34wks |

Project / data set: Chesler6 a.k.a. Chesler_2012
Excel file: Data_Description_B6x129S_Chesler2012.xlsx
CSV file: Chesler2012_B6x129S_B37_Data.csv
Readme / text file: readme_Chesler2012.txt
QC plots, figures, etc.: Chr12RFplot_Chesler2012.png
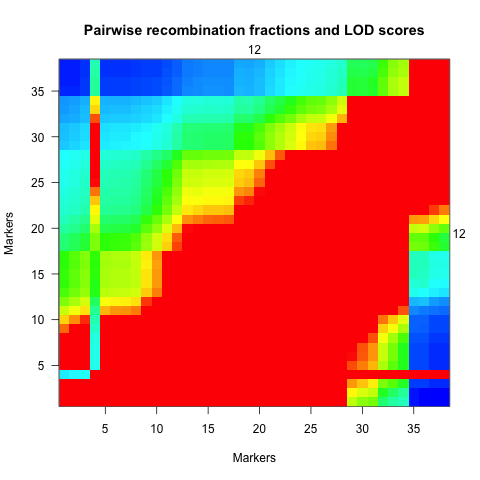
QC plots, figures, etc.: MapComparison_Chesler2012.png
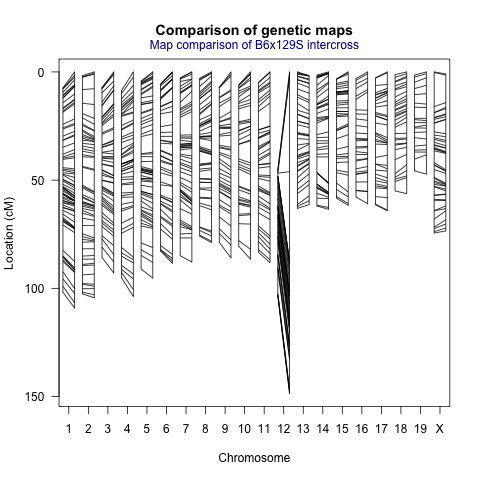
QC plots, figures, etc.: Mapplot_Chesler2012.png
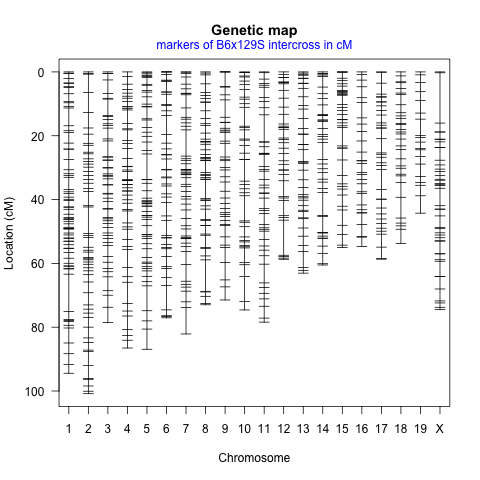
QC plots, figures, etc.: MissingGeno_Chesler2012.png
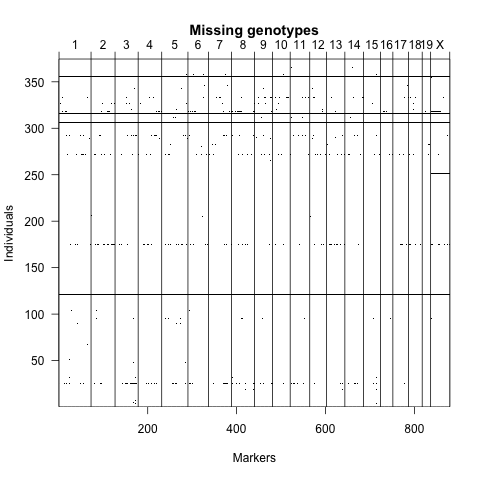
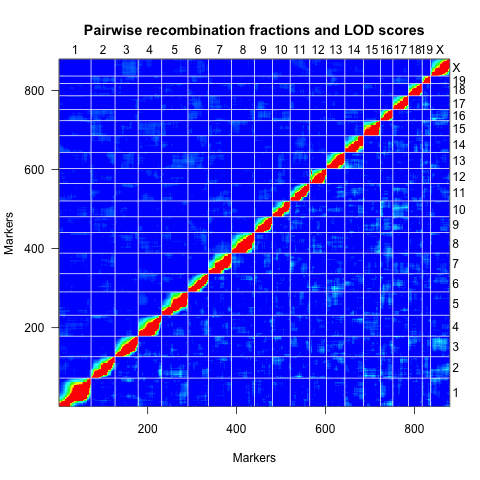
QC plots, figures, etc.: RFplot_Chesler2012.png