Bachmanov1 project protocol
NaCl taste thresholds in males of 13 inbred mouse strains (2011)
Bachmanov AAWith: Ishiwatari Y
Project protocol — Contents
Workflow and sampling
Equipment and supplies
Reagents and solutions
Procedure: Measuring water intake and sodium chloride (NaCl) taste threshold
Definitions and calculations
Data
ReferencesWorkflow
*= Data collected for calculating threshold measurements, but, not submitted.
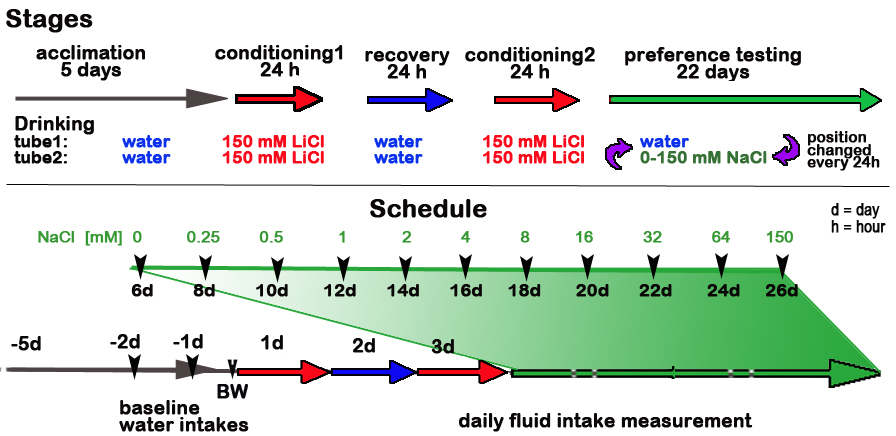
Drinking tube1 Drinking tube2 water water water water Mice weighed at the end of the acclimation period - - Mice given 150 mM lithium chloride (LiCl) for 24 h as conditioned stimulus (CS) LiCl solution LiCl solution Mice given water for 24 h to recover water water 3 Mice given 2nd round of 150 mM LiCl for 24 h LiCl solution LiCl solution 4 & 5 Mice primed for 2-bottle preference test preference testing water water 0 daily fluid intake* 6 to 26 Mice exposed to increasing concentration of sodium chloride (NaCl) after 48 h preference testing water NaCl solution 0.25, 0.5, 1, 2, 4, 8, 16, 32, 64, and 150 (NaCl) daily fluid intake* 6 to 26 Drinking tubes position switched after every 24 h during preference test preference testing NaCl solution water 0.25, 0.5, 1, 2, 4, 8, 16, 32, 64, and 150 (NaCl) daily fluid intake* Figure 1. Timeline of conditioned taste aversion (CTA) paradigm for measuring NaCl taste preference. (not drawn to scale)
- balance scale
- Drinking tubes, 25-mL plastic serological pipette with 0.2 mL gradations (Fisher cat no. 13-678-14B). This was connected to a 63.5-mm long stainless steel straight sipper tube (Unifab, Cat. No. US-171-25) with a 15-mm piece of silicon tubing (Cole Palmer, Cat. No. 06411-76). The spouts extended ~25 mm into the mouse cage and their tips were ~15 mm apart. Each spout had a tip with a 3.175-mm diameter hole from which the mice could lick fluids. The top of the pipette was closed with a size 00 rubber stopper. Tubes were always given in pairs, with one containing deionized water and the other taste solution (Fig. 1). The drinking tubes were placed to the (experimenter's) left of the food hopper. For more details go to Monell Mouse Taste Phenotyping Project (Bachmanov et. al., 2002).
- Sodium chloride (NaCl), Sigma-Aldrich Inc
- Deionized water
- NaCl solutions of increasing concentrations (0.25, 0.5, 1, 2, 4, 8, 16, 32, 64, and 150 mM)
- Lithium chloride (LiCl), Sigma-Aldrich Inc
- LiCl solution (150 mM)
Procedure: Measuring water intake and sodium chloride (NaCl) taste threshold
Taste thresholds for NaCl are measured using a technique previously developed (Ishiwatari and Bachmanov 2009). This technique uses CTA and subsequent 48-h 2-bottle preference tests and measures intensity generalization thresholds, which under optimal conditions reflect recognition thresholds. Intake measurements are made every 24 h by reading fluid volume to the nearest 0.1 mL.
a. Mice are acclimated to experimental settings and given deionized water in 2 drinking tubes for at least 5 days (refer to Fig. 1).
b. Baseline water intakes are measured on the last 2 days of the acclimation period.
c. Body weights are measured at the end of acclimation period.
d. LiCl (150 mM) is used as a conditioned stimulus (CS) during the 2 conditioning phases (see Fig. 1). Both drinking tubes are filled with 150 mM LiCl for only 24 h as an aversive stimulus and as the only source of fluid during the conditioning periods.
e. Periods of conditioning are separated by a recovery phase, wherein the mice are given deionized water for 24 h in both drinking tubes.
f. Following the second exposure to the aversive LiCl solution, mice are measured for NaCl taste preference beginning with deionized water for 48 h in both drinking tubes, and thereafter with one tube containing increasing concentrations of NaCl (0.25, 0.5, 1, 2, 4, 8, 16, 32, 64, and 150 mM) in solution and the other tube containing deionized water.
g. Positions of the drinking tubes (water vs NaCl) are reversed after every 24 h to control for side preferences.
h. Fluid intakes are adjusted for body weight by dividing each intake by the mouse's body weight for each mouse, and multiplying this by 30 (the approximate weight of an adult mouse).
i. Taste threshold is evaluated and calculated according to the description given below. For plotting preference score graphs for each strain, regression curve fit analysis is performed using the same function, but including the data for all mice from the same strain. For additional details: Monell Mouse Taste Phenotyping Project and Ishiwatari et al. 2012.conditioned taste aversion (CTA): involves conditioning mice to avoid LiCl and then examining avoidance of NaCl solutions presented in the ascending order of concentrations in 48 h 2-bottle preference tests.
preference scores: calculated as the ratio of the average 2-day solution intake to the average 2-day total fluid (solution + water) intake, in percent.
taste threshold: considered as a stimulus concentration at which a sigmoidal concentrationâresponse regression curve intersects the 25% level of preference scores. It is calculated as follows:
NaCl preference scores of each mouse for all tested concentrations except 0 mM are fit using the function:
f(x) = 50/(1 + exp (b(log(x)âlog(c))))
Where:
x = stimulus concentration
b = slope
c = stimulus concentration at half performance (25% preference score) = taste threshold concentrationGiven that:
maximum performance = 50% preference score = complete indifference
minimum performance = 0% preference score = complete avoidanceThe 25% threshold level is chosen as a midpoint between complete indifference and avoidance, which approximates the 50% level of correct responses.
Data collected by investigator
• daily water intake
• sodium chloride (NaCl) solution taste threshold
⢠daily NaCl intake (to calculate NaCl taste threshold)
• body weight