Rhodes1 project protocol
Exercise-induced hippocampal neurogenesis in adults of 12 diverse strains of mice (2010)
Rhodes JS, Clark PJWith: Kohman RA, Miller DS, Bhattacharya TK, Brezinska WJ
Project protocol — Contents
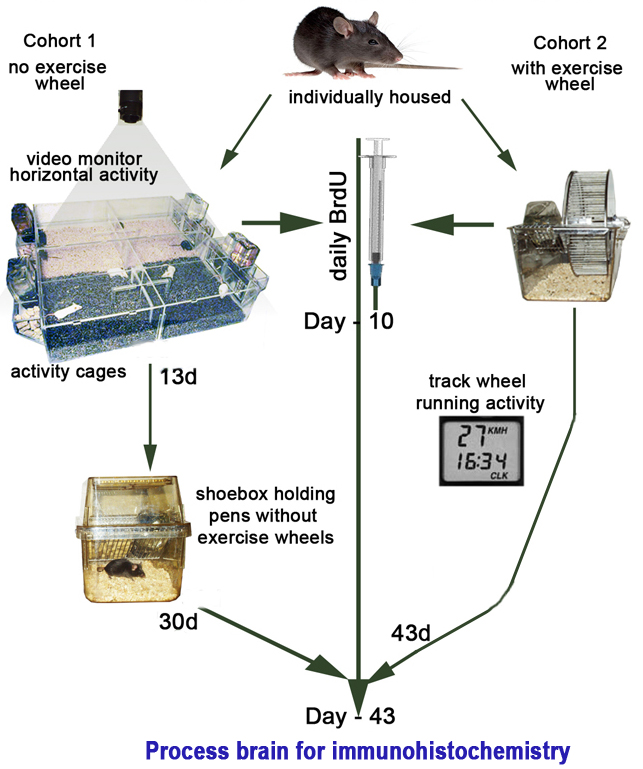
Workflow and sampling
Workflow and sampling
Equipment and supplies
Reagents and solutions
Procedures
Definitions
Data
ReferencesWorkflow
Cohort 2 (exercised):Wheel rotations are monitored continuously in 1-min increments for mice with exercise wheels After 43 days, the two cohorts are anesthetized with pentobarbital (ip) and then perfused transcardially with 4% paraformaldehyde to initially fix the brain Perfused brains are stored overnight in 4% paraformaldehyde to prepare the brain for sectioning and subsequent staining Brain sections are immuno-stained to visualize new neurons or neurogenesis • Custom-made activity cages with video tracking software (Figure 2)
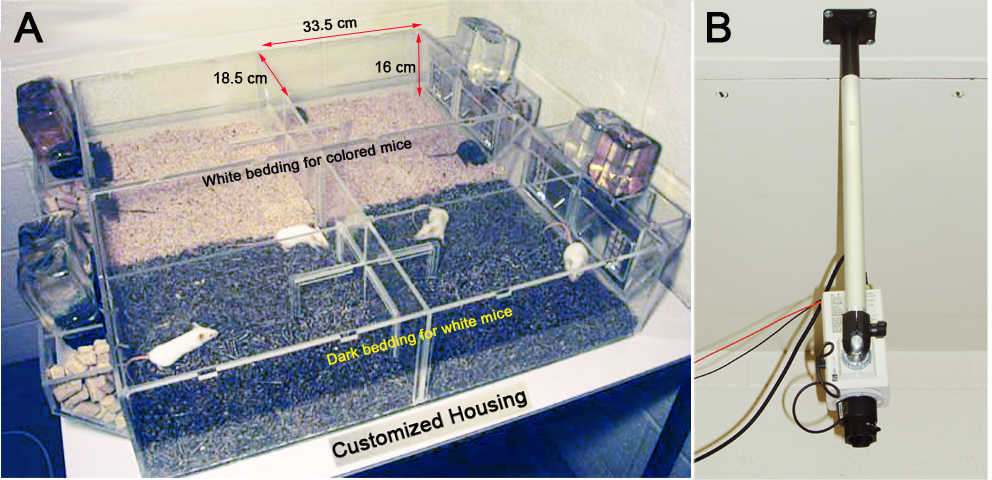
Cages (18.5 cm à 33.5 cm à 16 cm) are constructed out of clear plastic with food and water access mounted on the side. Horizontal distance traveled in the home cage is recorded using TopScan (Clever Sys, Vienna, VA, USA) video tracking software. TopScan software is run on a Dell Precision 380 workstation (Dell Computer, Round Rock, TX, USA) which is connected to a Nuvico digital color quad interface (Nuvico, Englewood, NJ, USA) and an Osprey-2000 (Viewcast, Dallas, TX) or WinTV (Hauppauge Computer Works, Hauppauge, NY, USA) capture card. Four Panasonic WV-CP244 cameras (Panasonic, Secaucus, NJ,USA) mounted 152 cm above the cages are used to capture the video used for analysis.
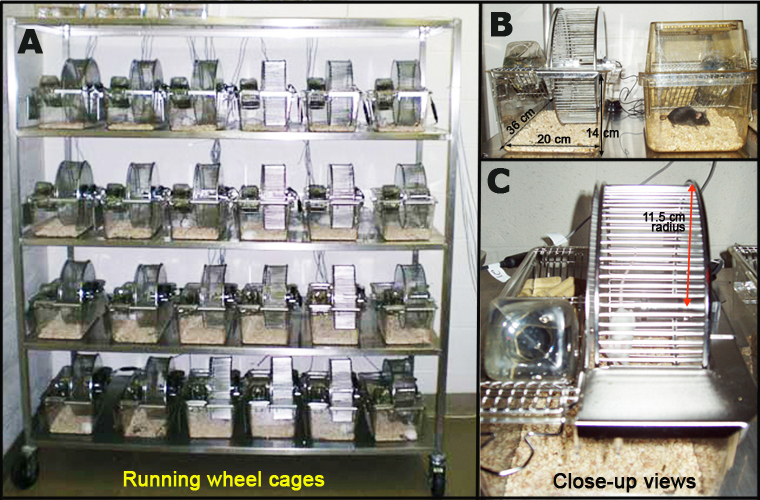
• Standard polycarbonate shoebox home cages without running wheels measuring 29 cm à 19 cm à 13 cm (L à W à H) (Figure 3B).
• Standard polycarbonate shoebox cages with running wheels measuring 36 cm à 20 cm à 14 cm with a 23 cm diameter wheel (Respironics, Bend, OR). Wheel rotations are monitored continuously in 1-min increments throughout the experiment via magnetic switches interfaced to a computer running VitalView software (Respironics, Bend, OR) (Figure 3).
• Balance scale
• Small rodent dissecting kit
• Peristaltic pump, as part of the perfusion setup
• Cryostat at -20°C
• Zeiss brightfield light microscope
• ImageJ software
• AnalySIS Opti Version 3.3.776 software (Soft Image System)
• Leica SP2 laser scanning confocal microscope (using a 40X oil objective, pinhole size 81.35 µm)
• Digital camera
Figure 2. Customized housing cages. Two different types of bedding are used depending on coat color. Corncob bedding (Harlan 7097) is used for dark coats, whereas Sheppard Paperchip® bedding is used for light coats.
Figure 3. Panel A: A rack-full of cages with running wheels. Panel B: Cages with (left) and without (right) running wheel. Panel C: Close-up view of a cage with running wheel.Perfusion essentials
• Pentobarbital sodium (Lundbeck Inc./Ovation Pharmaceuticals Inc., DeerWeld, IL, USA)
• needles and syringes
• 4% paraformaldehyde in a phosphate buffer solution (PBS)
• 30% sucrose in PBSCommon staining reagents
• 5-Bromo-2â-deoxyuridine (BrdU)
• Tris-buffering solution (TBS)
• 0.6% hydrogen peroxide
• 50% de-ionized formamide
• 10% 20X saline-sodium citrate (SCC) buffer
• 2N hydrochloric acid (HCl)
• 0.1 M Boric acid
• 0.3% Triton-X
• 3% goat serum in TBS (TBS-X plus)
• Avidin-Biotin Complex (ABC) staining system (Vector, Burlingame, CA)
• Diaminobenzidine (DAB) staining kit (Sigma, St. Louis, MO)BrdU-DAB staining essentials for detection of newly divided cells
• primary antibody against BrdU made in rat (Accurate, Westbury, NY)
• secondary antibody against rat made in goat at 1:250 in TBS-X plusDouble fluorescent labeling for detection of BrdU-positive (BrdU+) neuronal cells (NeuN+)
• primary antibody cocktail made of rat anti-BrdU (1:100; Accurate, Westbury, NY) and mouse anti-NeuN (1:50; Chemicon, Billerica, MA) to detect neuronal cells
• secondary antibody cocktail made with goat conjugated fluorescent markers (1:200; Cy3 anti-rat, Cy2 anti-mouse)• Superfrost/Plus microscope slides
1. Experimental Design
a. Mice are divided equally by strain and sex into two cohorts; one cohort housed with running wheels and the other cohort without (see Figure 1 above).
b. The first 10 days all mice receive daily injections of BrdU (50 mg/kg) for labeling dividing cells.
c. In Cohort 1 horizontal distance traveled per day in the activity cages is recorded the first 13 days using TopScan video tracking software (see Figure 2A and 2B).
d. Following day 13, non-exercised mice are transferred to standard polycarbonate shoebox cages (no wheels) where they remain individually housed for 30 more days (see Figure 1).
e. In Cohort 2 running wheel activities are monitored continuously in 1-min increments throughout the experiments via magnetic switches interfaced to a computer using VitalView software for the entire 43-day duration (see Figure 1 and Figure 3).2. BrdU administration
a. Fresh BrdU solution 0.5% is prepared a day in advance by dissolving BrdU in 0.007 N NaOH in 0.9% NaCl.
b. Each mouse is weighed to calculate the correct dose of BrdU (50 mg per kg bw).
c. Mice are injected with BrdU solution at about 11:00 am daily for 10 days.
d. Tails are marked to indicate test order, and then returned in their home cages.3. Perfusion for immunohistochemistry
a. After 43 days of home cage activity measurement, the mice are anesthetized with (150 mg per kg bw) sodium pentobarbital (ip).
b. Mice are then perfused intracardiac with 4% paraformaldehyde in PBS using a peristaltic pump.
c. Brains are post-fixed overnight, and transferred to 30% sucrose in PBS.
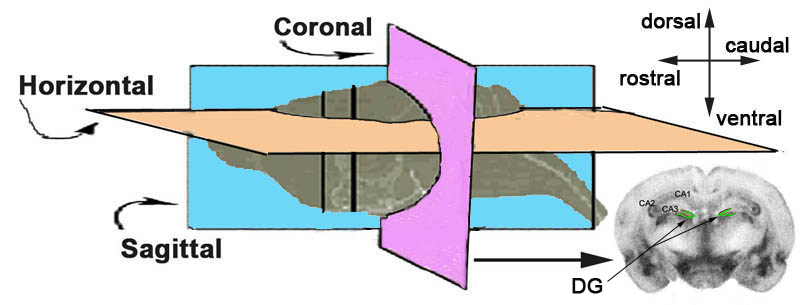
d. Brains are then sectioned using a cryostat into 40 µm coronal sections (see Figure 4 below).
Figure 4. Schematic illustration of the brain and the three planes for sectioning. DG = dentate gyrus (shown in green).e. Brain sections are stored in tissue cryoprotectant at -20°C.
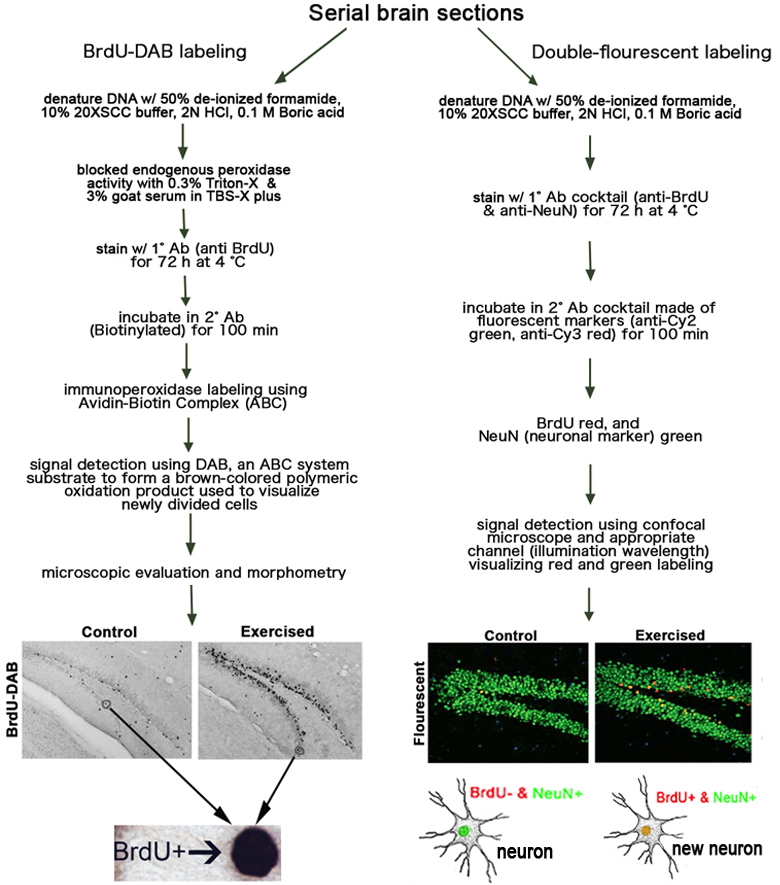
f. Two separate 1-in-6 series of these frozen brain sections (i.e., series of sections throughout the rostro-caudal extent of the brain with 240 µm increments separating each section) are immunohistochemically stained in each of the following ways:I- BrdU-DAB staining to detect the number of BrdU+ newly divided cells, located adjacent to or in the granule cell layer of the dentate gyrus.
a. Free floating sections are washed in TBS and then treated with 0.6% hydrogen peroxide.
b. Washed brain sections are pre-treated with 50% de-ionized formamide, 10% 20XSCC buffer, 2N hydrochloric acid, 0.1 M Boric acid to denature DNA for BrdU detection.
c. Denatured brain sections are initially blocked with a solution of 0.3% Triton-X and 3% goat serum in TBS-X plus.
d. Then the brain sections are incubated in primary antibody (anti-BrdU) for 72 hrs at 4°C, washed with TBS, and then treated with TBS-X Plus for 30 min.
e. Brain sections are then incubated in secondary antibody (goat anti-rat) for 100 min at room temperature.
f. Tissue sections are then treated using Avidin-Biotin Complex (ABC) system for enzyme-mediated immunodetection, commonly referred to as immunoperoxidase labeling.
g. To generate a brown-colored polymeric oxidation product used to visualize newly divided neurons, the sections are treated with diaminobenzidine (DAB), which is the substrate for the ABC system.
h. After color development, slide-mounted sections are rapidly dehydrated and cover-slipped for microscopic evaluation and morphometry.II- Double-fluorescent labeling to determine the fraction of BrdU+ in the dentate gyrus that co-label with anti-NeuN (marker for neuronal cells) (see Figure 5 below).
a. The same procedure as I-a to I-h above is used except another cocktail is used for the primary antibody step: rat anti-BrdU (1:100) and mouse anti-NeuN (1:50).
b. The secondary antibodies made in goat are conjugated with fluorescent markers (Cy2-anti mouse and Cy3 anti-rat) at dilution 1:200, likewise, delivered as a cocktail.
Figure 5. Representative sections through the dentate gyrus of a control non-exercised and an exercised mouse stained for BrdU with DAB on the left. Double-fluorescent staining BrdU red and NeuN (mature neuronal marker) green in the dentate gyrus on the right.4. Image analysis, counts of BrdU-labeled cells, and estimating dentate gyrus morphology
I. BrdU-DAB
a. The entire granule cell layer (bilateral) of the dentate gyrus in the hippocampus, represented in the 1-in-6 series is photographed by systematically advancing the field of view of the Zeiss brightfield light microscope, and taking multiple photographs of BrdU-DAB stained sections, via camera interfaced to computer, under 10X (total 100X) magnification.
b. Positively-labeled cells in these photographs are automatically counted using ImageJ software. To generate unbiased estimates of total number of BrdU-labeled cells in the dentate gyrus, the counted cells are first multiplied by 0.85 (assuming 15% of nuclei intersect the plane of the section, based on the observation that the average size of nuclei are 6 microns, which is 15% of a 40-micron section). Secondly, the number of cells per section is multiplied by 96, the average number of sections per dentate gyrus.
c. The total volume of the granule cell layer of the dentate gyrus represented in the series is estimated.II. Double-fluorescent labeling for BrdU and NeuN
a. For analyzing double-labeled brain sections, a Leica SP2 laser scanning confocal microscope (using a 40X oil objective, pinhole size 81.35 µm in diameter) is used to determine the fraction of BrdU+ cells that are double positive (BrdU+ NeuN+).
b. BrdU+ cells in the granule cell layer (represented in the 1-in-6 series) of the dentate gyrus in the hippocampus are analyzed by focusing through the tissue in the z-axis to detect co-labeling with anti-NeuN (see Z-plane stage encoder below).Data collected by investigator
• Locomotor activity
• Beginning and ending body weight
• Volume of dentate gyrus (granule cell layer)
• Number of new dentate gyrus neurons (granule cell layer)
• Density of new dentate gyrus neurons (granule cell layer)Brdu: primarily used as non-radioactive thymidine analog 5âbromo-2-deoxyuridine (BrdU) to detect recently dividing cells.
NeuN: marker for neuronal cells.
z-plane stage encoder: in studying hippocampal cell proliferation and neurogenesis, the most stringent and validated methodology used to quantify the number of newly divided cells eliminates many of the inherent biases encountered. This technique requires a microscope with a z-plane stage encoder and software for optical dissection and cell counting analysis.
Neurogenesis
To quantitate neurogenesis (N) per volume of the granule cell layer of the dentate gyrus (DG), the following formula was used:N = (t x f) / v
Where t = total number of BrdU+ cells in the DG [1]
f = fraction of BrdU+ cells that are also positive for the neuronal cell marker (BrdU+ NeuN+) [2]
v = volume of DG (estimated by serial sections) [1]
[1] determined by BrdU-DAB staining
[2] determined by double-fluorescent labeling (BrdU, NeuN)
References
Zombeck JA, Chen GT, Johnson ZV, Rosenberg DM, Craig AB, Rhodes JS. Neuroanatomical specificity of conditioned responses to cocaine versus food in mice. Physiol Behav. 2008 Feb 27;93(3):637-50. Epub 2007 Nov 12.
PubMed 18155256