Berndt2 project protocol
Unrestrained plethysmograph and anesthetized forced oscillation methods of measuring lung function in 29 inbred strains of mice (2010)
Berndt A, Leme AS, Paigen B, Shapiro SD, Svenson KLProject protocol — Contents
Procedure (non-invasive) for unrestrained plethysmography (UP)
Workflow and sampling
Equipment
Reagents, supplies, and solutions
Data
Procedure (invasive) for the forced oscillation technique (FOT)
Workflow and sampling
Equipment
Reagents, supplies, and solutions
Data
References
------------------------------------------
Whole Body Unrestrained Plethysmograph (performed at The Jackson Laboratory)
Workflow
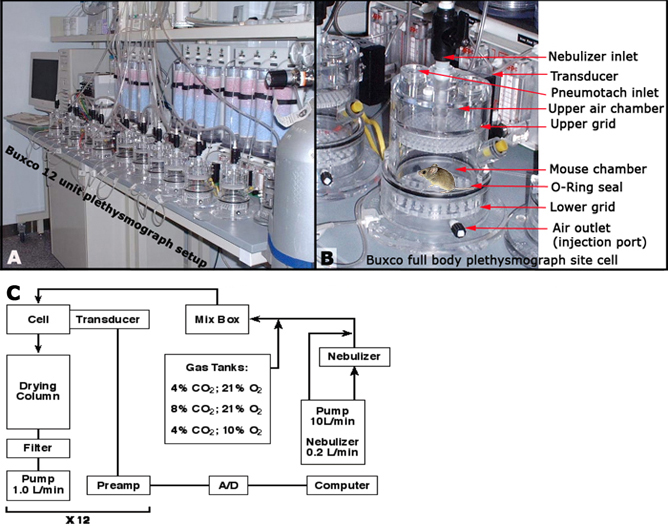
Step Mice are acclimatized within the plethysmography chamber for at least 15 min For baseline measurements, six 30-second data logs are collected Inspiratory and expiratory measurements For inhalation control (aerosolized saline) measurements, 8-10 30-second data logs are gathered Inspiratory and expiratory measurements For inhalation challenge (aerosolized methacholine (MCh) measurements, 8-10 30-second data logs are obtained Inspiratory and expiratory measurements • Buxco whole body plethysmograph (Model #PLY3211, Buxco Research Systems, Wilmington, NC)
Figures 1A to 1C. Unrestrained plethysmograph layout for high-throughput phenotyping.
• 1 mL syringe
• Drierite drying agent
• Garbage bags
• Yellow, labeled hazardous waste disposal bags
• Buxco-supplied screwdriver
• Nalgene L900, diluted 2 to 4 mL per liter of water, in a squirt bottle
• Paper towels
• Vaseline
• Saline
• Sample (customer-supplied test agent or vehicle solution such as PBS, etc.)
• Distilled water
• Disposable plastic cups
• Methacholine (MCh, SigmaâAldrich Inc., St. Louis, MO, USA)
• Associated document: Procedure log bookProcedures (non-invasive) for unrestrained plethysmography (UP)
a. Mice are placed from the home cage into a plethysmograph chamber.
b. Each mouse is subjected to a standard protocol, which consisted of the following procedures:1) Mice are acclimatized within the plethysmography chamber for at least 15 min.
2) Baseline measurements are collected as six 30 s data logs.
3) Inhalation challenge measurements in response to aerosolized saline or increasing concentrations of MCh (5, 10, 20 MCh dissolved in saline) are collected as eight to ten 30 s data logs.Investigator's Notes: "In order to ensure that each mouse received the same MCh exposure, we tested the efficiency of the nebulizer at the beginning of each test week and adjusted the time of exposure to deliver the same MCh concentration to each animal. When the nebulizer was new, the time was generally 2.5 min, but as the nebulizer got older and became less efficient, the time was often extended. When the time required was more than 3.5 min to achieve the same MCh dose, the nebulizer was discarded."
c. Inspiratory (Pi) and expiratory (Pe) pressures, as well as inspiratory (Ti) and expiratory (Te) times, are measured. Likewise, tidal volume (Vt) is obtained for the derivation of minute ventilation (MV).
d. Based on the recorded measurements for Pi, Pe, Ti, and Te, enhanced pause (Penh) is calculated according to the following equation:
Penh = (Pi/Pe) * ((Te-Tr)/Tr)
Where Tr is the relaxation time (i.e., the time interval that includes 63% of the integrated expiratory pressure signal).
e. Additional UP parameters, including total respiratory time (Ti + Te= Ttot), duty cycle (Ti/Ttot), and various ratios, such as inspiratory flow rate (Vt/Ti), expiratory flow rate (Vt/Te), and overall respiratory flow rate (Vt/Ttot) are also calculated for each mouse.
For additional information regarding assessment of pulmonary function: Whole Body Plethysmograph
For Bench setup, machine start-up, and calibration.
Data collected by investigator
*All listed parameters are available as MPD measurements.
Parameters measured Short name Definitions and calculations
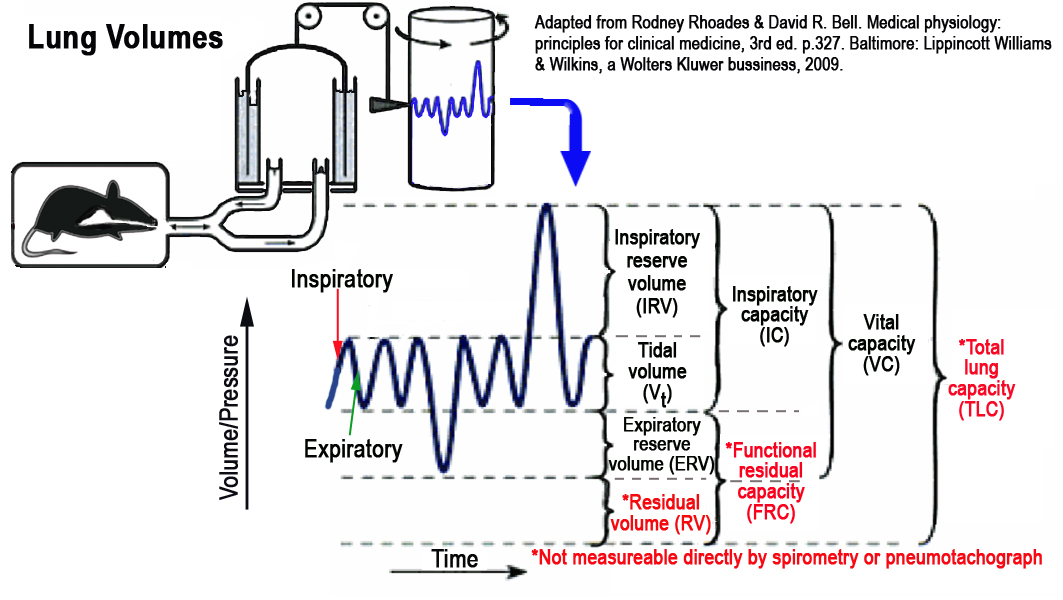
Figure 2. Schematic and graphic illustration of lung volumes in the mouse.
Lung volumes and lung capacities refer to the volume of air associated with the various phases of the respiratory cycle. Note that in Figure 2 above, lung capacities are inferred from lung volumes which are directly measured.
Breath frequency is the number of breathing cycle (inspiratory and expiratory) over a given period of time.
Duty cycle: applies to UP functions which are intermittent rather than continuous, thus, referring to the ratio of the time UP operates to its total cycle time (see Chatburn and Mireles-Cabodevila, 2011).
Tidal volume is the amount of air inspired or expired from the lungs under normal breathing conditions.
Minute ventilation (minute volume) is the amount of air inspired or expired from the lungs in 1 minute:
MV = Vt x F
---------------------------------------------
Forced oscillation technique (performed at University of Pittsburgh)
Workflow and Sampling
Mice are allowed to acclimate in their new facility for <3 wks • Balance scale
• Electric hair clippers such as the Oster Finisher Trimmer (Cat. # 76059-030, Oster Professional Products, McMinnville, TN)
• 19 G cannula
• Small rodent dissecting/surgical pack (forceps, scissors)
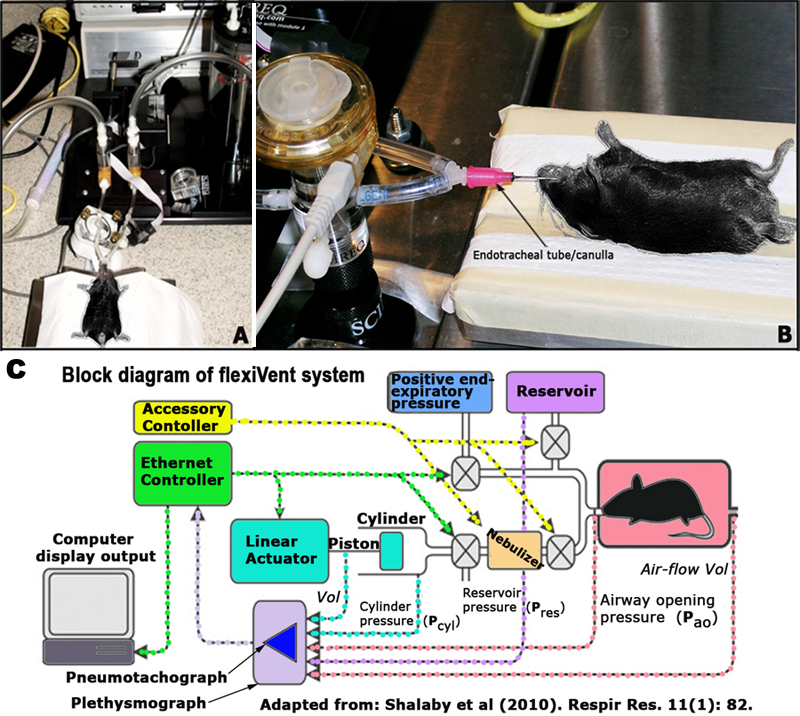
• Computer-controlled ventilator (flexiVent, SCIREQ, Montreal, QC, Canada)
• ultrasonic nebulizer (Aeroneb® Lab Nebulizer System by Aerogen Ltd., Galway, Ireland)Figures 2A and B. Forced oscillation technique setup and layout. Figure 2C. Schematic diagram of the flexiVent system.
• 5-0 USP surgical suture
• methacholine (MCh, SigmaâAldrich Inc., St. Louis, MO, USA)
• pentobarbital sodium (Ovation Pharmaceuticals Inc., Deerfield, IL, USA),Procedure (invasive) for the forced oscillation technique (FOT)
a. Mice measured with the invasive FOT are age-matched and are allowed to acclimatize for at least 7 days.
b. Body weights are measured for the calculation of anesthetic dose.
c. Mice are anesthetized by intraperitoneal (i.p.) injection of 60 mg per kg body weight pentobarbital sodium.
d. Following adequate anesthesia, mice are positioned ventro-dorsally (supine) for tracheostomy (see Figures 3A-D below).
e. A 19G cannula is gently inserted into the trachea and secured using 5-0 USP surgical suture, and mice are attached to a computer-controlled piston ventilator (see Figures 2A-D above).
f. Each mouse receives a tidal volume (Vt) of 10 mL/kg body weight at 120 breaths/min with 0-cm H2O positive end-expiratory pressure (PEEP) (i.e., baseline ventilation).
g. Following 5 min of stabilization one deep lung inflation (DI) is applied to ensure uniform lung recruitment and to normalize to the same volume history for each mouse. This DI procedure consisted of a constant 1.0 mL airflow with a pressure limited to 20 cm H2O over 4 s followed by a passive exhalation.
h. Baseline impedance measurements are then obtained in triplicates during regular sinusoidal ventilation.
i. Following baseline measurements, mice are maintained under baseline ventilation for another 3 min, after which a 2nd set of impedance measurements are taken without preceding DI. This 2nd set of baseline measurements is used to calculate the mean baseline values per strain.
j. Saline or MCh challenges (1, 3, 10 and 30 MCh) are delivered by channeling inspiratory flow from the ventilator through an ultrasonic nebulizer. During aerosol challenge the piston delivers a Vt of 40 mL/kg at 30 breaths/min.
k. Following consecutive challenges with (1, 3, 10, 30 mg/mL) MCh the piston is returned to delivering a Vt of 10 mL/kg at 120 breaths/min and impedance measurements are taken, which is followed by a DI to re-open the lungs.
l. Impedance measurements are taken every 5 s within the period of 30 to 60 s after each aerosol challenge. Hence, for each aerosol challenge 6 to 12 impedance measurements are reported, of which is calculated as the mean of the 3 highest values. The impedance is derived from the signals detected by the ventilator piston volume displacement (i.e., flow) and cylinder pressure (i.e., pressure), which is obtained during 8 s oscillatory volume perturbations (i.e., Prime-8 perturbations). The perturbations consisted of sine waves with frequencies ranging between 0.5 and 19.75 Hz.
m. The impedance is then fitted to a constant-phase model of the viscoelastic lung, from which the parameters Rn (i.e., central airway resistance) and H (i.e., tissue elastance) are obtained. (Because the major objective of the Berdt2 project is to compare Rn and Penh, the detection of Rn changes due to MCh exposure is of primary significance.)
n. At the peak of Rn response, the associated H parameter is also recorded. It is noteworthy that because H usually peaks after Rn, the reported H values may not reflect peak H measurements.For additional information regarding invasive assessment of pulmonary function: Flexivent
Data collected by investigator
Parameters measured Short name Definitions and calculations
Plethysmograph is a device for measuring changes or fluctuations in the volume of air within lungs.
Pneumotachograph (pneumotach) is a device for measuring the instantaneous flow of respiratory gases or the rate of air flow during breathing.
Measurements in passive subjects
For passive anesthetized subjects, the single compartment model is commonly fit to airway opening pressure and flow obtained from a body plethysmograph during mechanical ventilation with passive expiration. However, it is advantageous to fit the model to data obtained during a Single-frequency Forced Oscillation maneuver where amplitude and frequency content are precisely standardized. This is the technique used by the flexiVent. In both cases, measurements represent respiratory system mechanics that include both lung and chest wall components (unless the chest wall is surgically opened).Resistance is most commonly estimated using mathematical model-fitting techniques such as Multiple Linear Regression that take all data points into account.
1) For the determination of airway resistance, a constant phase model is fitted to the data from multiple frequencies simultaneously applied at the airway opening.
2) After each of the 5 challenges, airway resistance (Raw) in 12 cycles of 30â60 s is recorded.
3) Changes in Raw as a function of the log-transformed MCh concentration administered is then plotted.
R = Resistance = Dynamic resistance is a quantitative assessment of the level of constriction in the lungs.
Calculation of the slope measures for Penh, Rn and H
For all measures Penh, Rn and H, the strength of their increase is determined (Penh_slope, Rn_slope and H_slope) with consecutive increases in MCh exposures.For each mouse respiratory indexes (Penh_slope, Rn_slope and H_slope) the following are derived:
1) Mean Penh, Rn and H response of each mouse at each dose (i.e., individual value).
2) Since the raw data together are not normally distributed, each dose and each individual value are log-transformed.
3) To the log-transformed data of MCh concentrations (5, 10, and 20 for Penh and 1, 3, 10, and 30 for Rn and H) the response index, therefore, is defined as the slope of the line of best fit.
References
Chatburn RL and Mireles-Cabodevila E. Handbook of Respiratory Care, 3rd ed. pp 141-2. (book) Jones & Bartlett Learning, 2011.
Rhoades R and Bell DR. Medical physiology: principles for clinical medicine, 3rd ed. p.327. (book) Lippincott Williams & Wilkins, 2009.
Shalaby KH, Gold LG, Schuessler TF, Martin JG, Robichaud A. Combined forced oscillation and forced expiration measurements in mice for the assessment of airway hyperresponsiveness. Respir Res. 2010 Jun 21;11:82.
PubMed 20565957 FullText